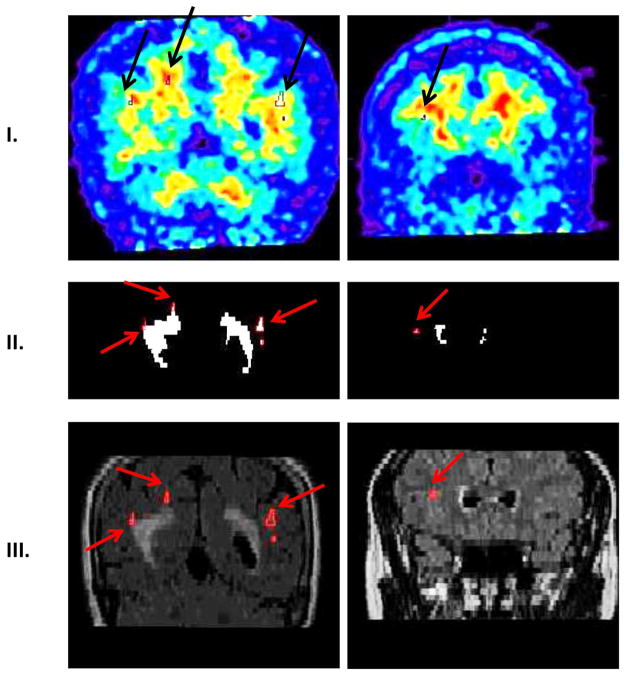
Figure 2.
Separation of deep WML (DWML) from the WML mask. Row I shows PiB images (DWML outlined in black with black arrows). Row II shows WML mask (DWML outlined in red with red arrows). Row III shows FLAIR images (DWML outlined in red with red arrows). First column represents case presented in Figure 1A, second column case presented in Figure 1B.

