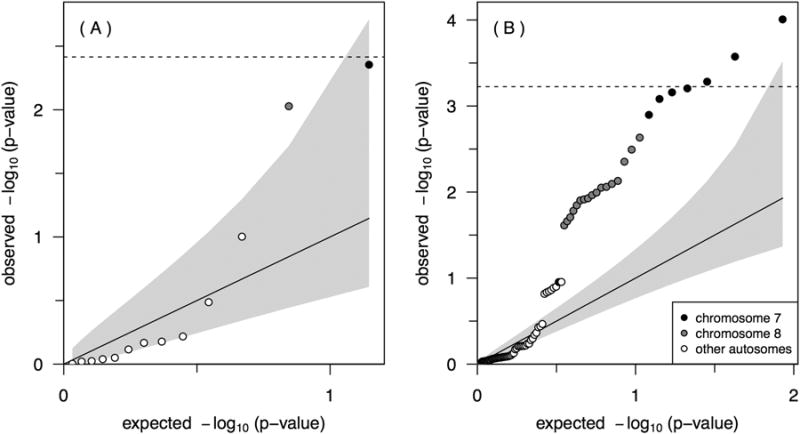
Figure 2.

Quantile-quantile plots of expected versus observed −log10 p-values for the 13 CNP regions (A) and the corresponding 84 CNP components (B). The grey regions indicate confidence regions for the respective order statistics under an independence assumption, though the CNP components are highly correlated due to their proximity within regions.
