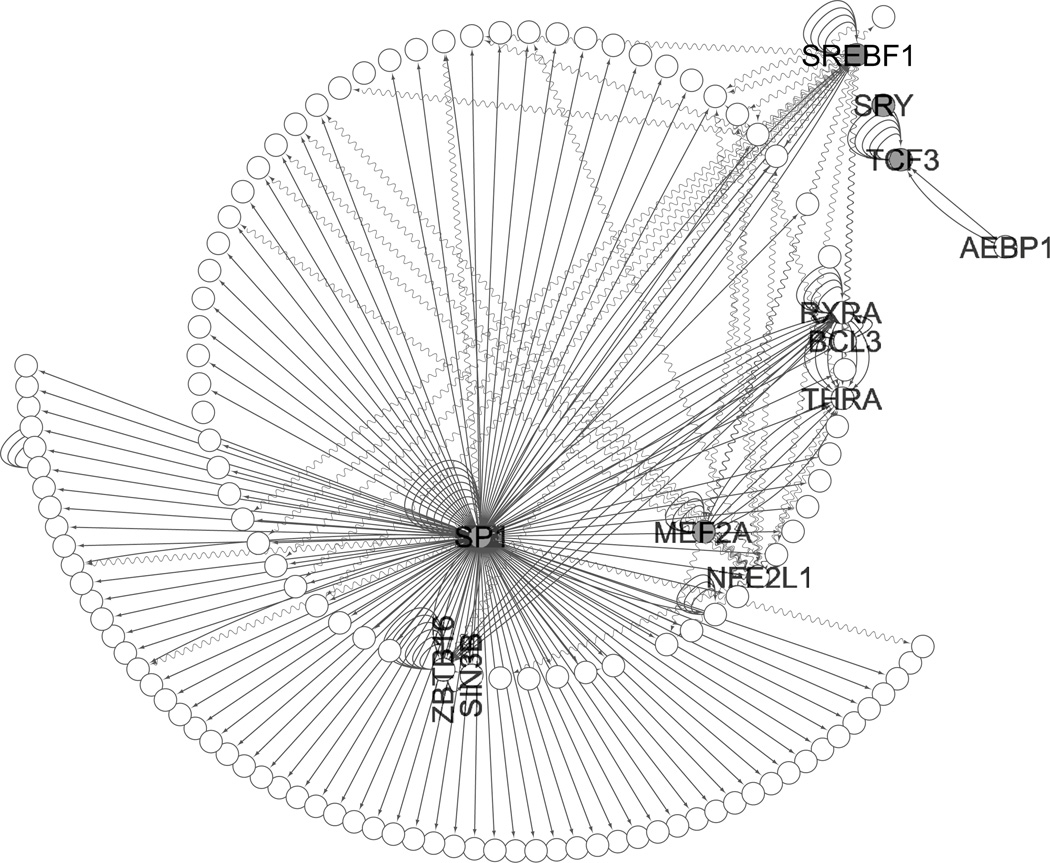
Fig. 4.
Cyan module with TFs identified as indicated in grey; SP1 is in the middle. Legend edges represent experimentally verified interactions; straight lines are ChIP experiments or protein-protein interactions, wavy lines are siRNA preturbation experiments. All nodes were connected when predicted interactions were included (data not shown)

