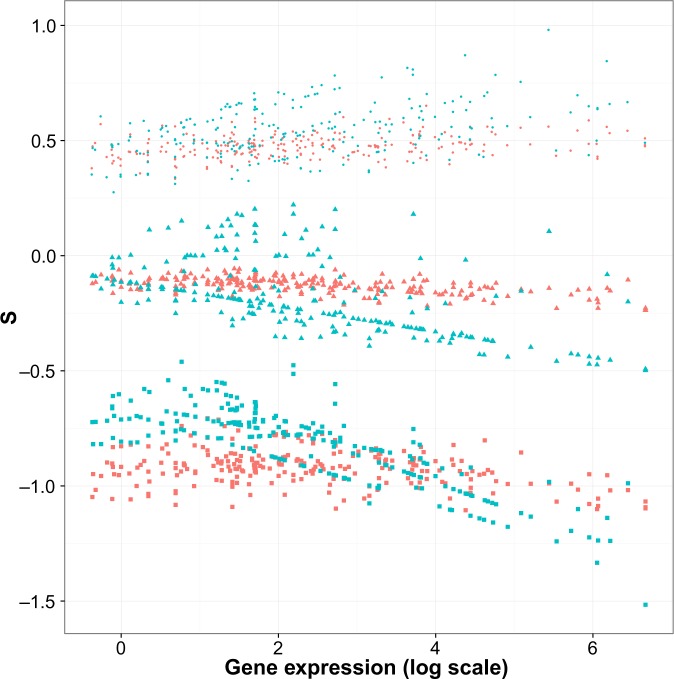
Figure 4.
Comparison of S = 2N s estimates between nonsynonymous and synonymous point mutations to human genes. For each protein-coding human gene, estimates of S were obtained for possible nonsynonymous (red) and synonymous (blue) point mutations at each site. The x-axis represents the logarithm of the geometric mean across tissues of expression measurements for a gene. The y-axis represents inferred scaled selection coefficients (S). For each gene, the scaled selection coefficient distribution among point mutations is summarized by the 5th percentile (square shape), the 50th percentile (triangular shape), and the 95th percentile (round shape).

