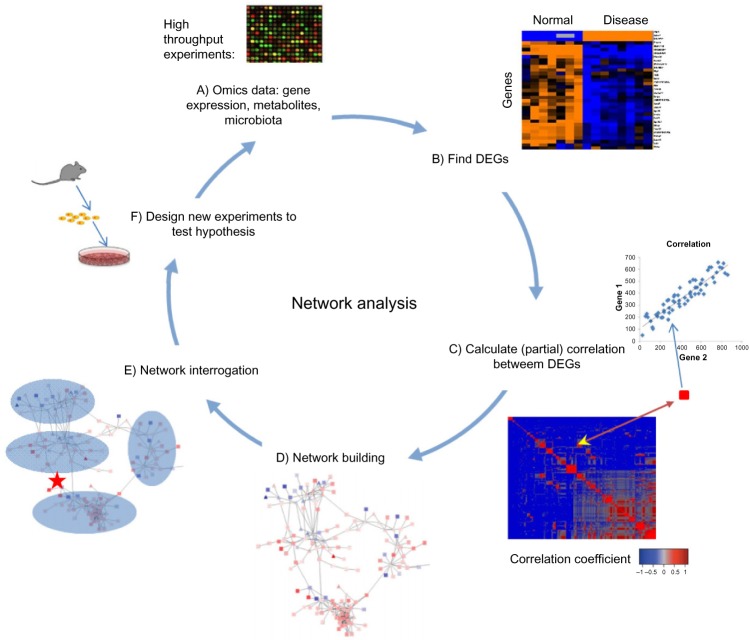
Figure 1.
Workflow of network analysis. (A) Network analysis starts from data obtained from high-throughput experiments such as microarray experiments detecting expression of genes in samples. (B) Differentially expressed genes are found between two states of a system (eg, normal vs disease). (C) Correlations of DEGs based on their expression values are calculated to detect regulatory relationship among them. (D) Significant correlations suggest connections between differentially expressed genes (DEGs) and are used to generate a network of DEGs. (E) Network interrogation is performed to detect modules, key regulators, and functional pathways that are important for state transitions. (F) Based on the findings from network interrogation, new hypotheses are generated, which can be tested in newly designed experiments. Data from new experiments could also be subject to further analysis.

