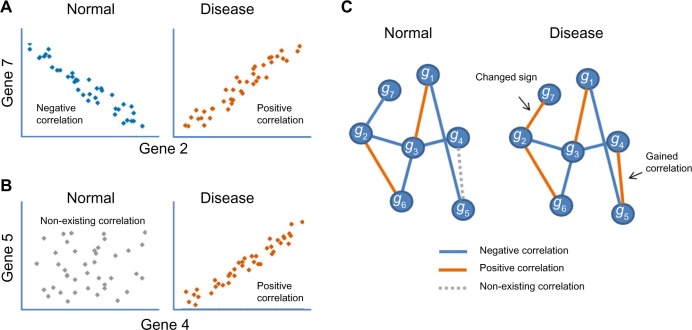
Figure 4.
(A) Gene 2 and gene 7 correlate with each other in both normal and disease conditions, but the signs of the correlation coefficient are opposite. (B) In normal condition, there is no correlation between gene 4 and gene 5, but they gain positive correlation when the biological system transitioned to disease. (C) Example of visualization of a network transitioning between normal and disease conditions. Red lines represent positive correlation, blue line represent negative correlation, and dotted gray lines represent nonexisting correlations in one condition that strongly appear in the other condition (on this case, becomes positively correlated).

