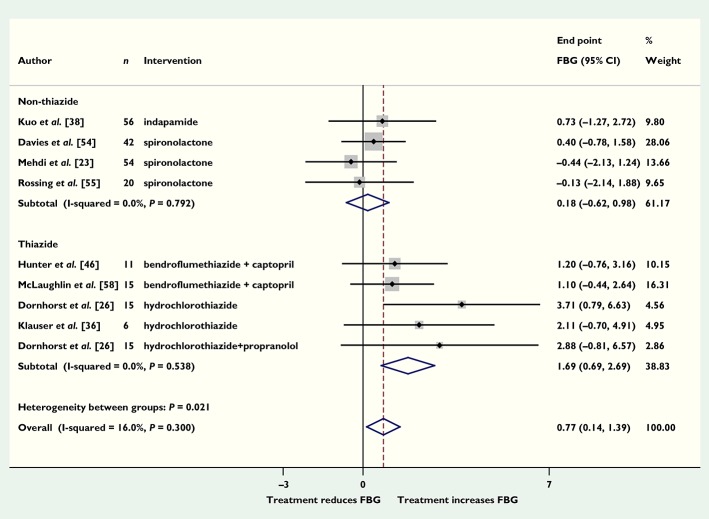
Figure 3.
Mean difference in end point fasting blood glucose (FBG) (mmol l−1) with diuretics vs. placebo (boxes) and pooled estimates (diamond) calculated by the inverse variance fixed effects model. Horizontal bars and diamond widths represent 95% CIs and box sizes indicate relative weights in the analysis

