
Figure 1.
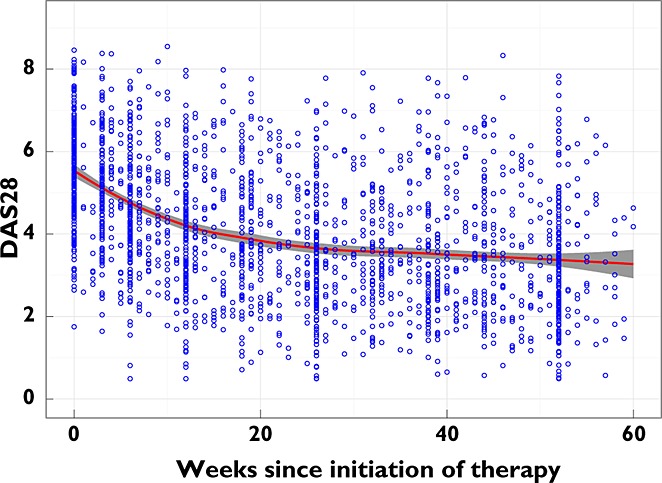
Observed data. Blue circles represent the DAS28 observed in the study population, the red line is a loess-smoothed line and the grey ribbon shows the 95% confidence intervals of the smoothed line
Official websites use .gov
A
.gov website belongs to an official
government organization in the United States.
Secure .gov websites use HTTPS
A lock (
) or https:// means you've safely
connected to the .gov website. Share sensitive
information only on official, secure websites.
Observed data. Blue circles represent the DAS28 observed in the study population, the red line is a loess-smoothed line and the grey ribbon shows the 95% confidence intervals of the smoothed line