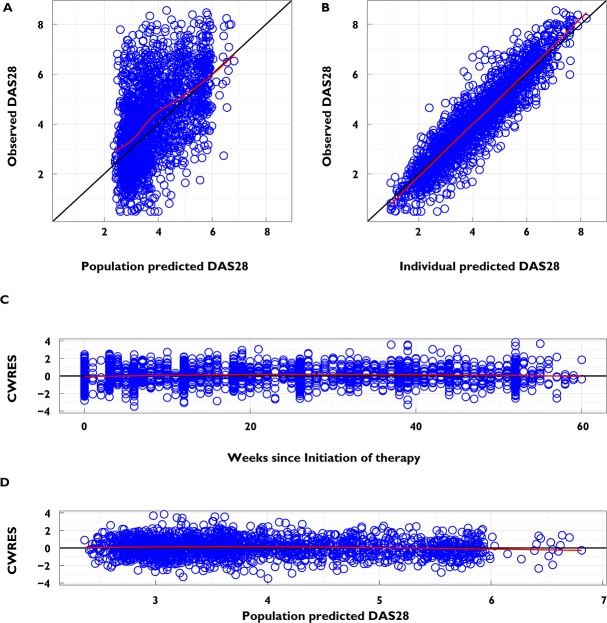
Figure 2.
Diagnostic plots for the final model. (A) Observed DAS28 vs. population predicted DAS28. Data should be evenly distributed about the line of identity, indicating no major bias in the population component of the model. (B) Observed DAS28 vs. individual predicted DAS28. Data should be evenly distributed about the line of identity, indicating an appropriate covariate model could be found for each individual. (C) Conditional weighted residuals vs. weeks since initiation of therapy. Data should be evenly distributed about 0, indicating no major bias in the structural model. (D) Conditional weighted residuals vs. the population predicted DAS28. Data should be evenly distributed about 0, indicating no major bias in the residual error model. The black line is a line with slope of 1 or 0, and the red line is a loess-smoothed line for the data

