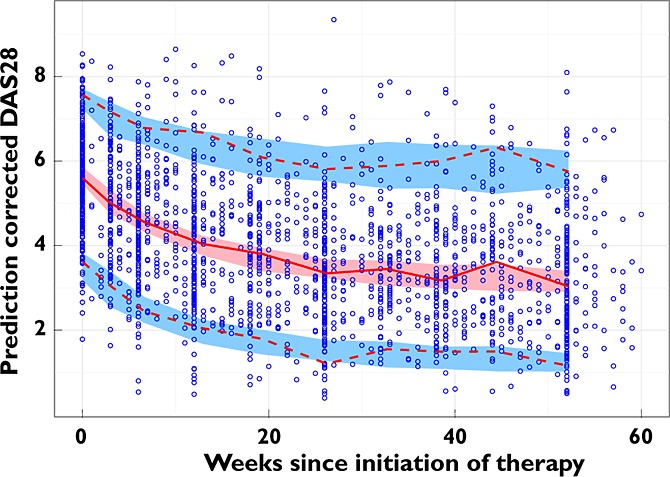
Figure 3.

Prediction-corrected visual predictive check of the final model. The prediction-corrected observed data are represented by blue circles, a red solid line (median), and the red dashed lines (5th and 95th percentiles). The prediction-corrected simulated DAS28 are represented by the red shaded area (empirical 95% confidence interval of median) and the blue shaded areas (empirical 95% confidence intervals of 5th and 95th percentiles). Statistical data were binned into 10 groups to calculate the median and 5th and 95th percentiles without the lines being influenced by areas of sparse data. The model predictions overlay the observed data with good agreement, and show the progressive drop in DAS28 from the baseline value to a new treated level
