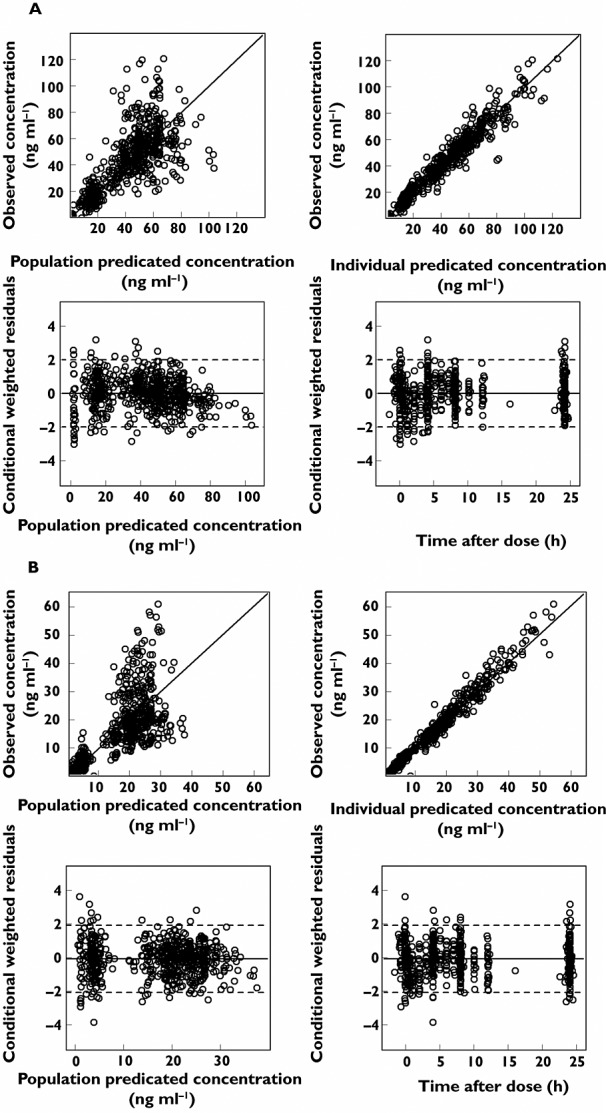
Figure 3.

Goodness-of-fit plots for model predicted sunitinib (A) and SU12662 (B) concentrations. The plots include observed vs. population predicted concentration, observed vs. individual model predicted concentration, conditional weighted residuals (CWRES) vs. population predicted concentration and CWRES vs. time after dose
