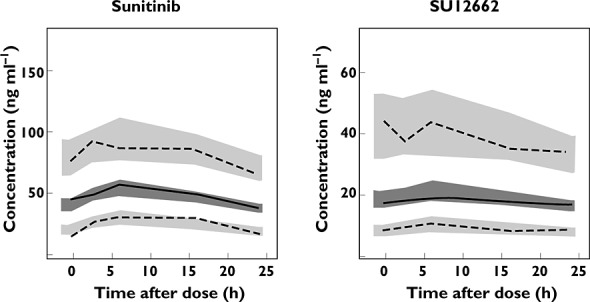
Figure 4.

Prediction-corrected visual predictive check of sunitinib and SU12662 concentration. Solid lines and dark grey areas represent the median observed values and simulated 95% confidence intervals (CIs). Dashed lines and light grey areas represent the 5% and 95% percentiles of the observed values and 95% CIs of the simulated percentiles
