
Figure 5.
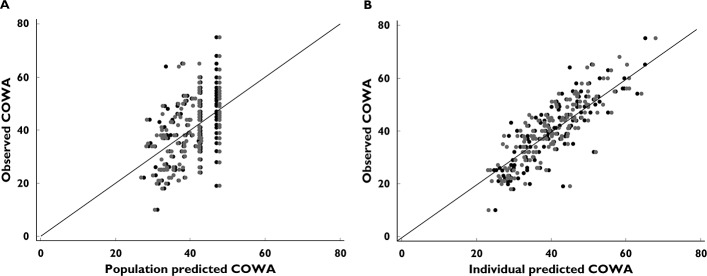
Goodness-of-fit plots from both analyses of continuous and discrete (Poisson) models. (A) Identity plot of observed vs. population predicted COWA. (B) Identity plot of observed vs. individual predicted COWA. • model for continuous data;  , poisson distribution model;
  , line of identity