
Figure 6.
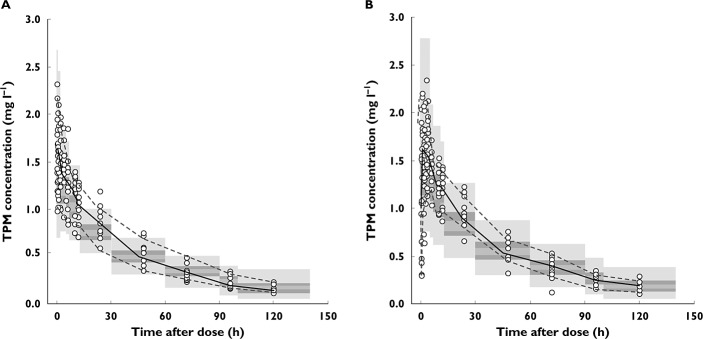
Visual predictive check plots of observed stable-labelled intravenous (A) and oral (B) TPM concentrations. Overlaid in grey bands are the 95% confidence intervals of the 50th (median), 5th and 95th quantiles of the simulated data sets from the PK model.  , observed median;
  , observed 5th, 95th percentiles