
Figure 7.
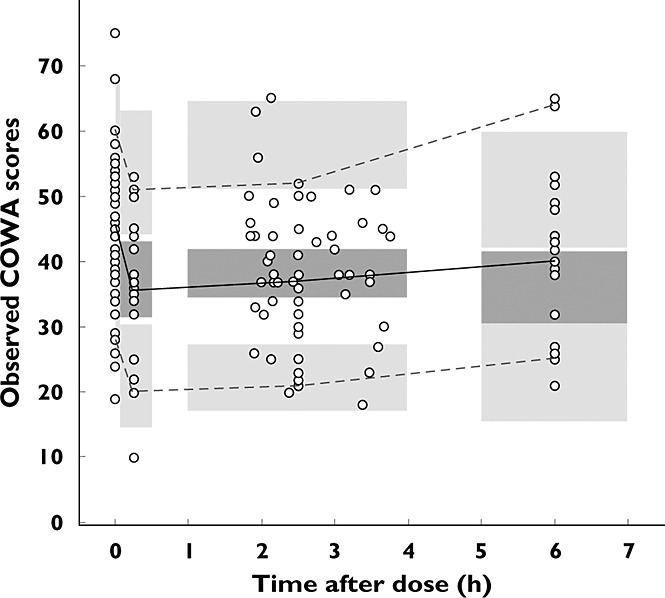
Visual predictive check plot of observed COWA; the overlaid grey bands are the 95% confidence intervals of the 50th (median), 5th and 95th quantiles of 1000 simulated datasets from the final PK-PD link model.  , observed median;
  , observed 5th, 95th percentiles