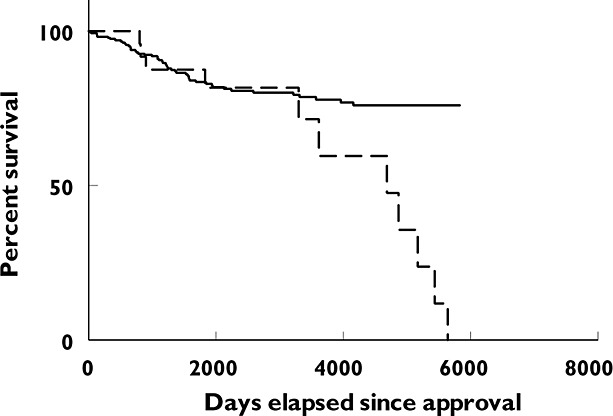
Figure 2.

Kaplan−Meier curve showing time to first serious safety warning or removal from market for new active substances: approval through NOC/c vs. standard review.  , NOC/c;
  , standard review. Curves significantly different, P = 0.0113, log rank (Mantel−Cox) test
