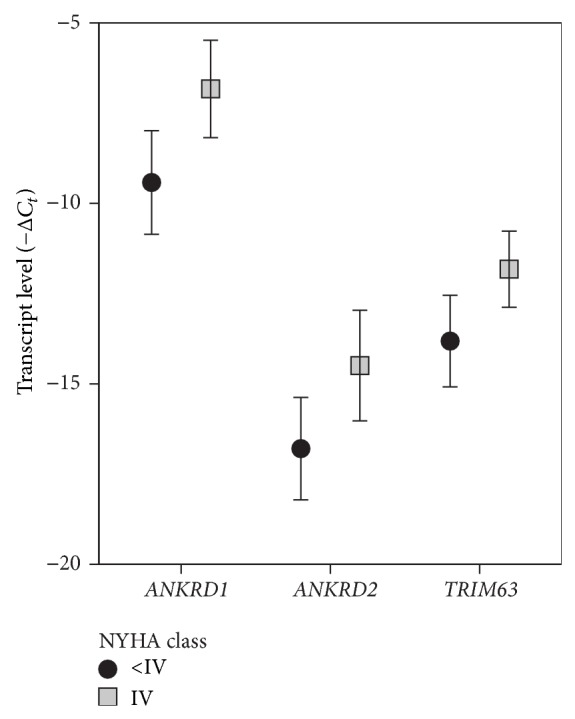
Figure 1.

Myocardial titin ligand expression patterns associate with disease progression in IDCM patients. Statistically significant titin ligand expression differences represented as bar graph. Data are presented as mean ± 2 s.e.m. Note the highest expression level and the most pronounced difference between groups in ANKRD1 expression pattern.
