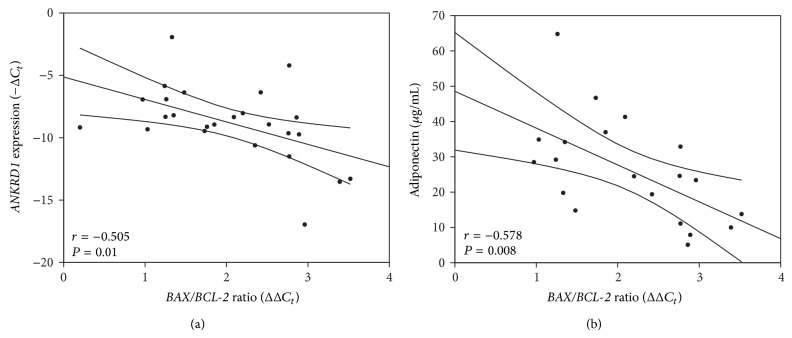
Figure 4.
ANKRD1 and adiponectin correlate with tissue propensity to apoptosis. (a) Linear correlation between ANKRD1 expression and BAX/BCL-2 ratio. Regression line is represented within 95% confidence interval for the mean value. A negative correlation between ANKRD1 expression (−C t) and BAX/BCL-2 ratio (C t) was found (n = 25, r = −0.505, P = 0.01). (b) Linear correlation between adiponectin levels and BAX/BCL-2 ratio. Regression line is represented within 95% confidence interval for the mean value. A negative correlation between serum adiponectin levels (μg/mL) and cardiac BAX/BCL-2 ratio (C t) was observed (n = 20, r = −0.578, P < 0.01).

