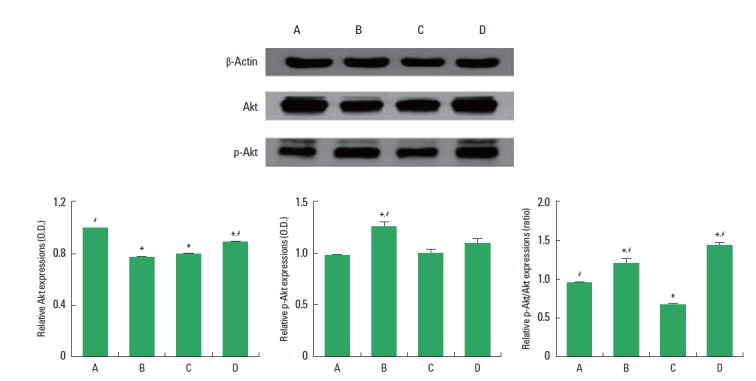
Fig. 3.

Effect of treadmill exercise on the phosphor-Akt (p-Akt) and Akt expressions in the hippocampus. Upper: Representative expressions of p-Akt, Akt, and β-actin in the hippocampus. Lower left: Relative Akt expression in the hippocampus. Lower middle: Relative p-Akt expression in the hippocampus. Lower right: Relative ratio of p-Akt/Akt in the hippocampus. (A) Control group, (B) exercise group, (C) diabetes-induction group, and (D) diabetes-induction and exercise group. The data are presented as the mean± standard error of the mean (SEM). *P< 0.05 compared to the control group. #P< 0.05 compared to the diabetes-induction group.
