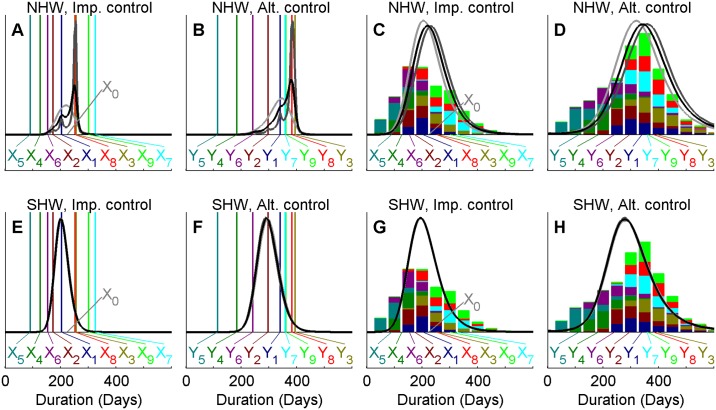
Fig 2. Ensemble prediction for the UK 2001 FMD outbreak duration.
Comparing two methods of ensemble prediction of expected outbreak duration under implemented and alternative control actions (panels A, E and B, F, respectively) as well as the corresponding duration of individual outbreaks (panels C, G and D, H, respectively). The observed duration of the UK 2001 FMD outbreak is indicated by X0 while vertical colored lines (panels A, B, E and F) and annotations X1, X2,.., X9 and Y1, Y2,…, Y9 indicate the mean outbreak duration of each projection. The total bar height (panels C, D, G, H) indicate the frequency of simulations across all projections with outbreaks ending within each 50 day interval and colors indicate the contribution of each of the projections. Results are shown for analyses of the large discrepancy ensemble using the NHW method (panels A-D) and the SHW method (panels E-H). Marginal posterior estimates correspond to different priors, with prior parameters aλ = bλ = 0.01 (light gray), aλ = bλ = 0.001 (black) and aλ = bλ = 0.0001 (dark gray) the NHW method (panels A-D) and Aaλ = Abλ = Baλ = Bbλ set to 0.01 (light gray), 0.001 (black) and 0.0001 (dark gray) for the SHW method (panels E-H). Note that posterior estimates are very similar for the latter, making the lines overlap.

