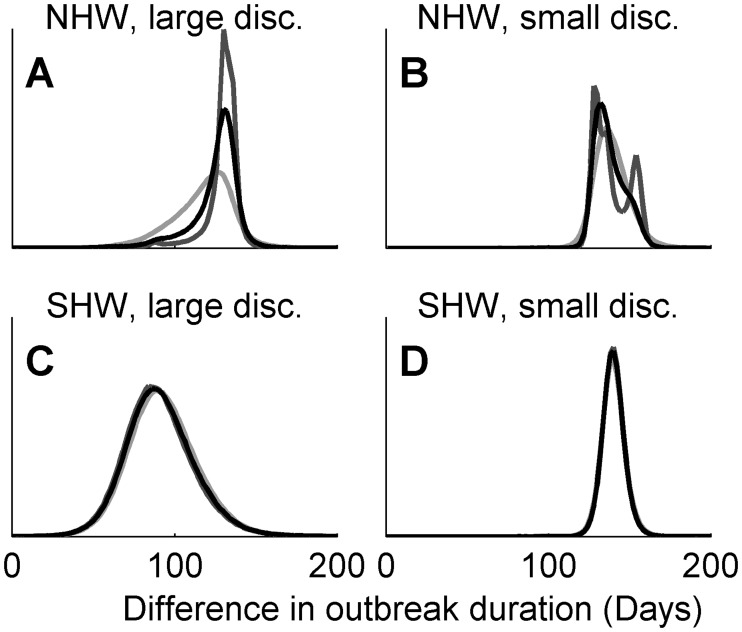
Fig 3. Ensemble predicted difference between control actions.
Posterior predictive distributions of the difference in outbreak duration between implemented and alternative control actions for the 2001 UK FMD outbreak using the NHW method (panels A, B) and the SHW method (panels C, D,). Results are shown for large (panels A, C) and small (panels B, D) discrepancy among projections in the ensemble. Marginal posterior estimates correspond to different priors, with prior parameters aλ = bλ = 0.01 (light gray), aλ = bλ = 0.001 (black) and aλ = bλ = 0.0001 (dark gray) for the NHW method (panels A, B) and Aaλ = Abλ = Baλ = Bbλ set to 0.01 (light gray), 0.001 (black) and 0.0001 (dark gray) for the SHW method (panels C, D). Due to high similarity of estimates, the plots are largely overlapping for the hierarchical method.

