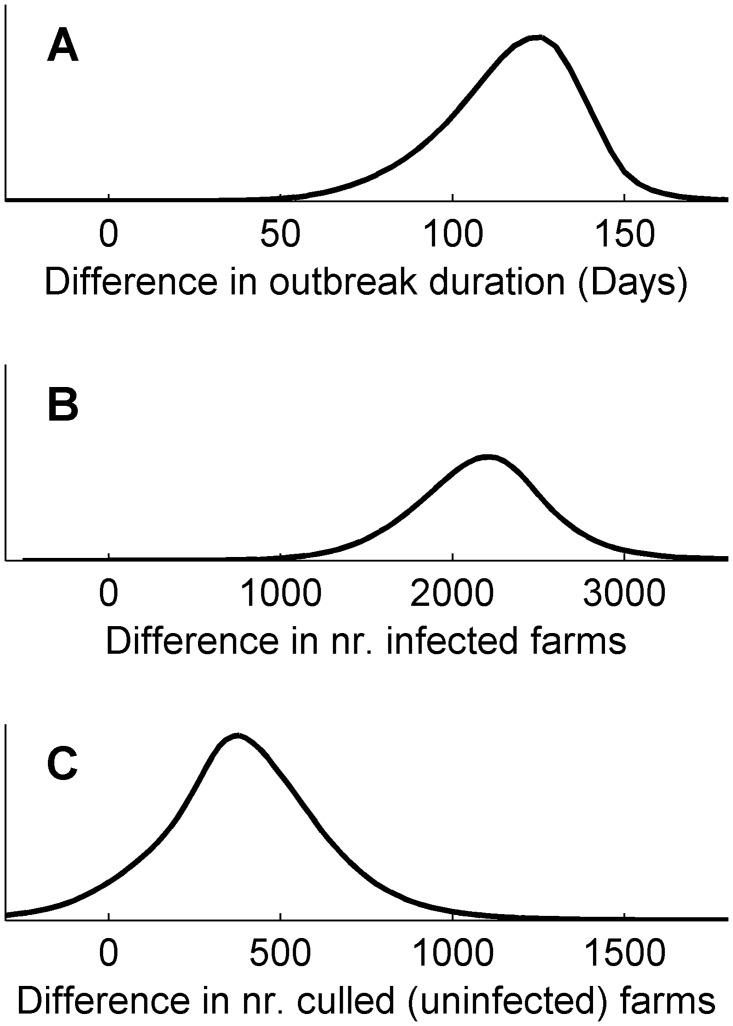
Fig 7. Posterior estimates of difference between controls.
The figure shows the marginal posterior predictive estimates of difference in outbreak duration (Panel A), number of infected farms (Panel B) and number of control culls (Panel C) between the implemented and alternative control action. The figure shows the result of the large discrepancy ensemble.

