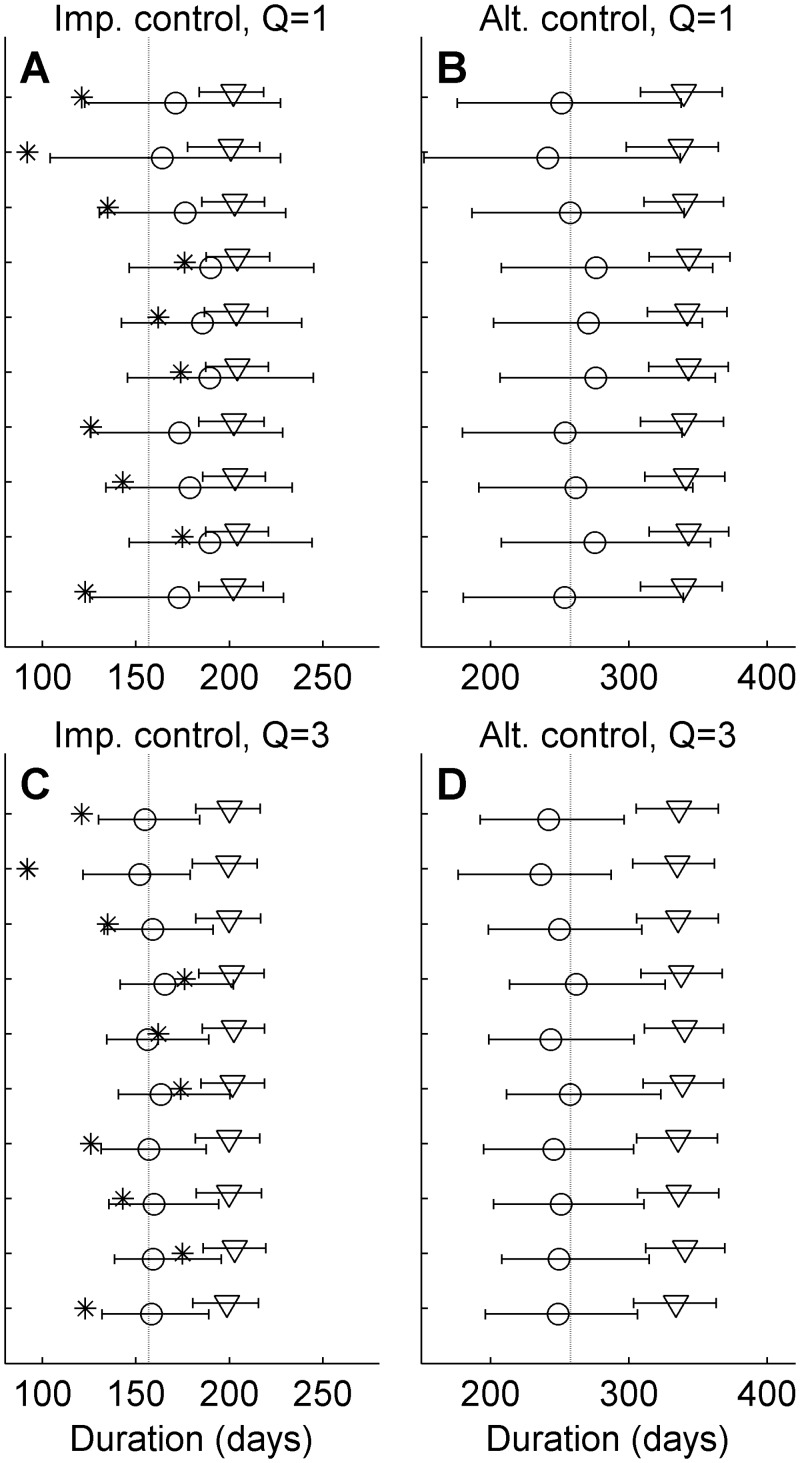
Fig 9. Analysis of synthetic data.
Triangles and circles indicate the median posterior estimates of mean outbreak duration after analysis with the small and large discrepancy ensemble, respectively, under the implemented (Panels A and C) and alternative (Panels B and D) control action. Results are shown for ten realizations of synthetic data simulated with k1 = k2 = 0.9. The error bars indicate the 95% credibility interval, the dashed lines the true values and the star the individual realization analyzed (expected to often lie outside the predicted mean). Panels A and B show the results of single quantity analysis (only outbreak duration) and Panels C and D the corresponding results of analyses where number of infected farms and control culls are included.

