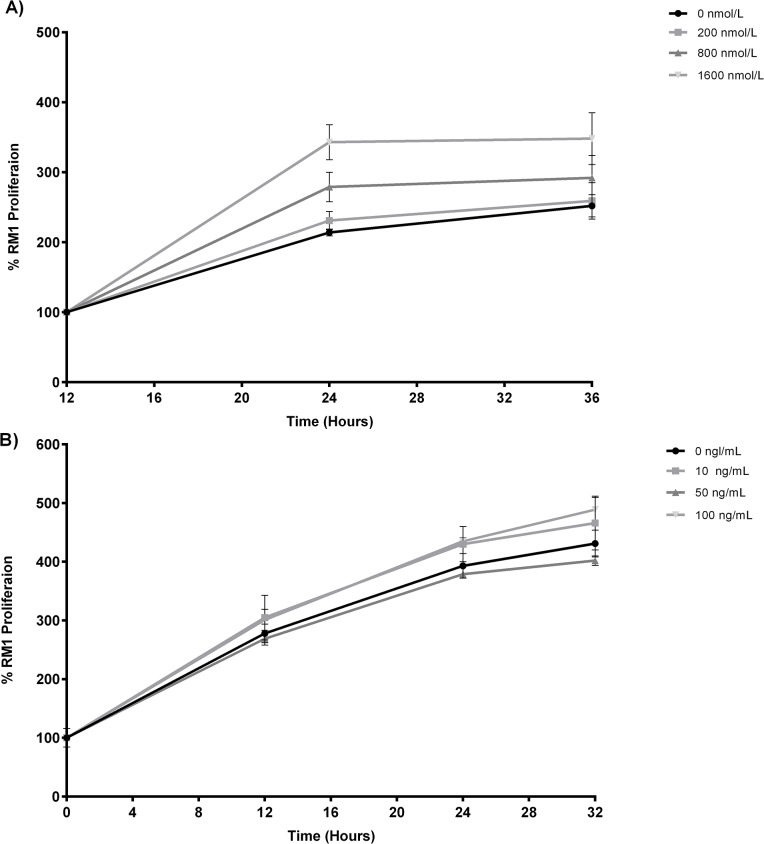
Fig 4. Cell proliferation assay in the presence of insulin e leptin.
RM1 cell proliferation in the presence of different insulin concentrations (0, 200, 800, 1600 nmol/L) evaluated by determination of the % of resazurin reduction at different time points (A) (p<0.01 1600 nmol/L vs 800, 200, 0 nmol/L at 24h, one-way ANOVA, Newman-Keuls multiple comparison post-hoc test). RM1 cell proliferation of in the presence of different leptin concentrations (0, 10, 50, 100 ng/mL) evaluated by determination of the % of resazurin reduction at different time points (B).

