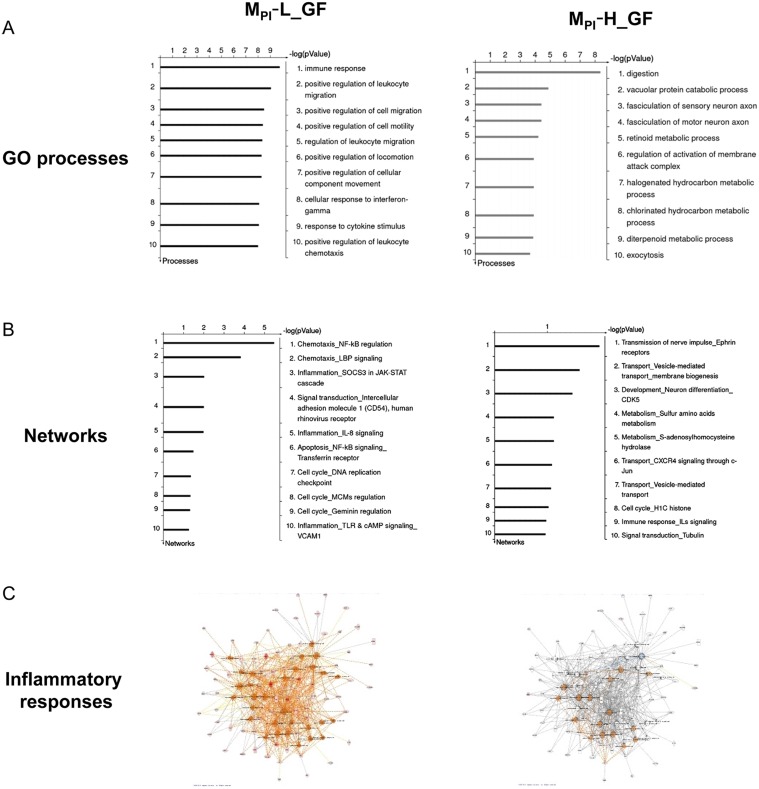
Fig 3. MetaCore gene enrichment analysis of ileum microarray data representing microbiota effects in preweaned MPI-L and MPI-H-gnotobiotic mice.
MPI-L and MPI-H induced differentially expressed genes were analyzed by GeneGO MetaCore software. Panel A: Top 10 overrepresented GO biological processes in preweaned MPI-L, H vs GF mice. Panel B: Top 10 scored overrepresented networks in preweaned MPI-L, H vs GF mice. Panel C: Comparison of the differentially expressed genes in MPIL_GF and MPI-H_GF presented in inflammatory response-related networks using the IPA program. Orange line: activation; Blue line: inhibition; Grey: not present.

