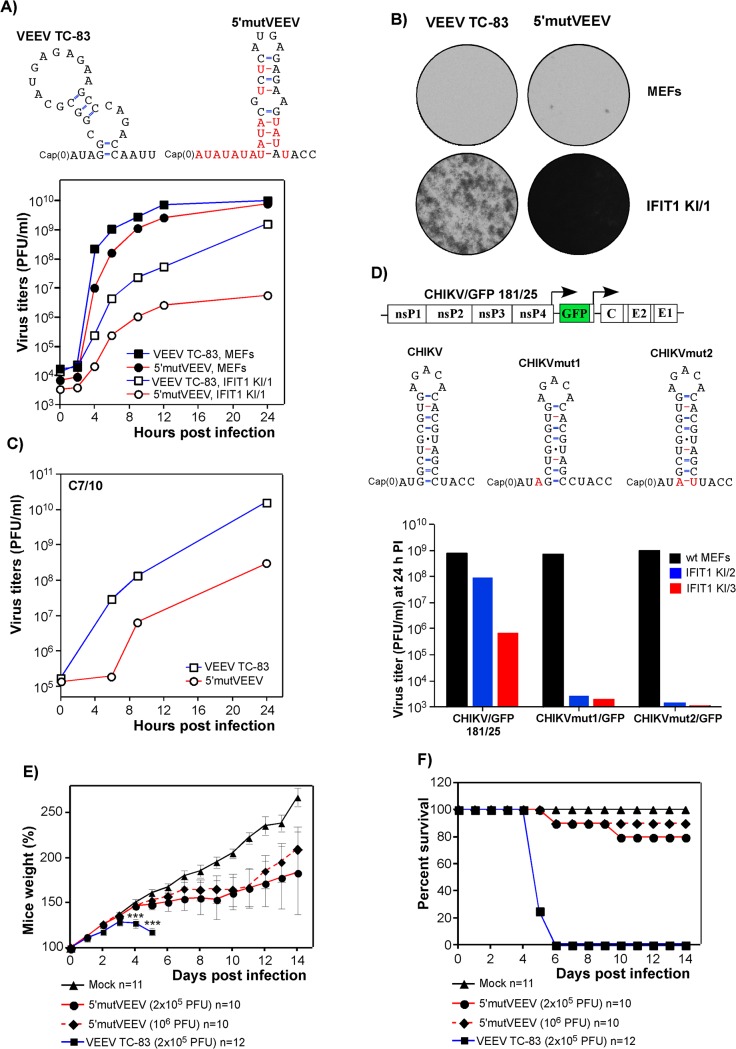
Fig 9. Alphavirus resistance to IFIT1 can be manipulated genetically and leads to virus attenuation.
(A) The computer prediction of the 5’UTRs of the parental VEEV TC-83 and 5’mutVEEV viruses. To analyze the replication rates, wt MEFs and IFIT1 KI/1 cells were infected at an MOI of 5 PFU/cell with VEEV TC-83 and 5’mutVEEV, media were replaced at the indicated times PI, and virus titers were determined on BHK-21 cells. (B) At 48 h post infection, cells used for analysis of virus replication were stained with crystal violet to assess for CPE. (C) C7/10 cells were infected at an MOI of 10 PFU/cell with VEEV TC-83 and 5’mutVEEV, media were replaced at the indicated times PI, and virus titers were determined on BHK-21 cells. (D) The schematic representation of the CHIKV/GFP 181/25 genome and computer predictions of the original and newly designed 5’UTRs. Rescued viruses were used to infect wt MEFs, IFIT1 KI/2 and IFIT1 KI/3 cell lines at an MOI of 5 PFU/cell, and at 24 h post infection, virus titers were determined by plaque assay on BHK-21 cells. (E and F) Six-day-old NIH Swiss mice were infected via s.c. route with the indicated doses of VEEV TC-83 or the designed VEEV variant with mutated 5’UTR (5’mutVEEV). Mice were monitored daily in terms of weight change (E) and survival (F).Unpaired T-test was used to compare weight change between the VEEV TC-83 and 5’mutVEEV groups (both 2x10⁵ and 106 PFU) at day 4 and 5 post-infection. ***: p<0.001. Survival curves of the VEEV TC-83 and 5’mutVEEV groups (both 2x10⁵ and 106 PFU) are significantly different (p-values <0.001).

