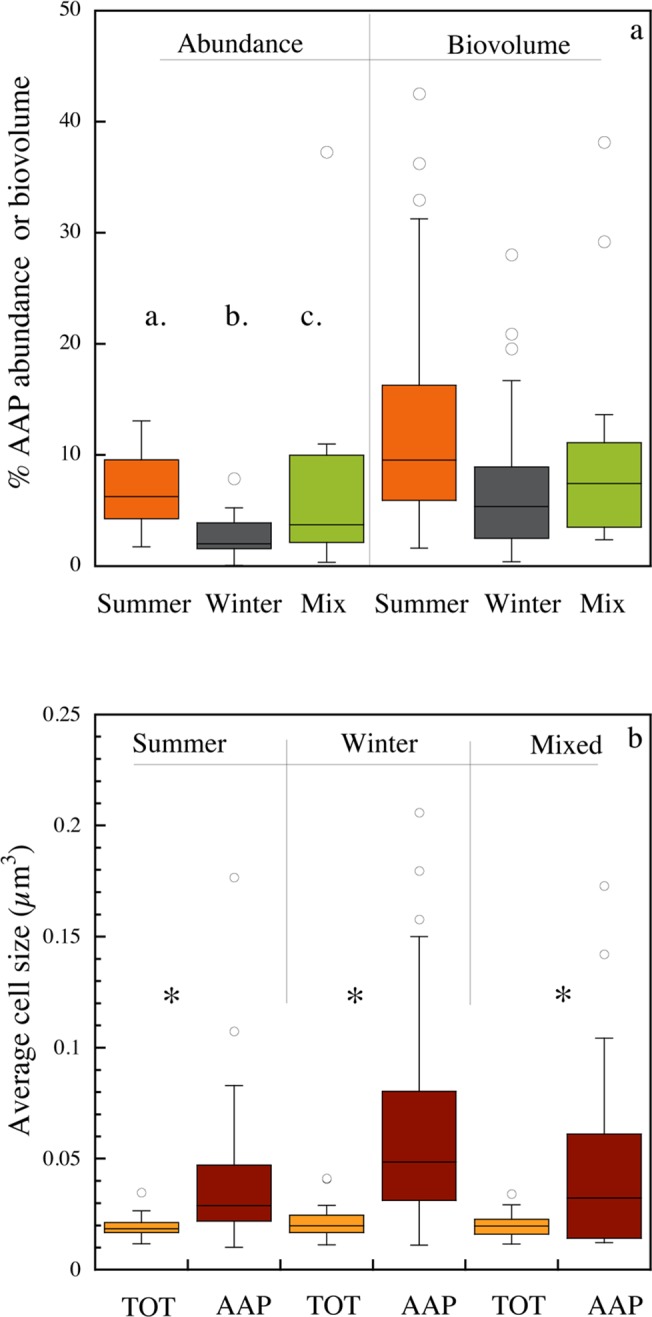
Fig 2. Seasonal patterns in the contribution of AAP bacteria to (a) total bacterial abundance and to biovolume, and (b) in the average cell size of AAP and total bacteria.

The box-and-whisker plots show the average, 75% quartiles and extremes values, and stars indicate significant differences (p<0.05).
