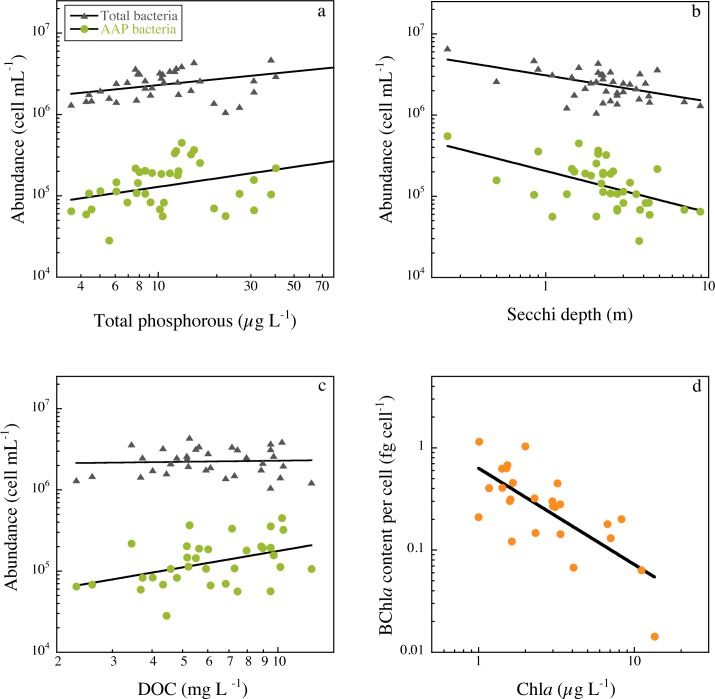
Fig 4. The relationship of total bacterial abundance (triangles) and AAP bacterial abundance (circles) with total phosphorous concentration (a), Secchi depth (b), and DOC concentration (c).
BChla contents per cell as a function of mean lake chlorophyll concentration (d). Data have been log-transformed, the line is the least-square regression, and details of the regression models are given in Table 1.

