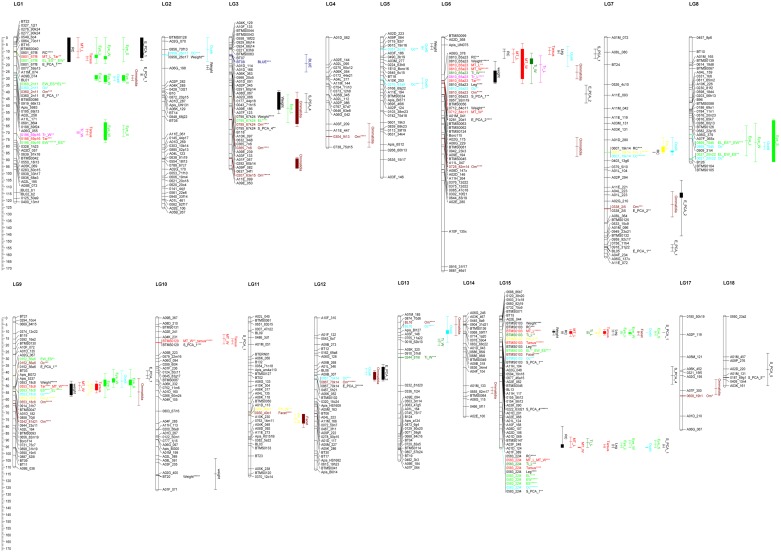
Fig 2. Genetic linkage map showing the distribution of the suggestive and significant QTLs.
QTLs for each trait are colour coded: (i) forewing radial cell length(RC), body mass (weight), and length of hind leg (Leg) in black; (ii) metatarsus length (MT_L), metatarsus width (MT_W), and tarsus length (tarsus) in red; (iii) trochanter length (Tr_L), and trochanter width (Tr_W) in fuchsia; (iv) femur length (Fm_L), and femur width (Fm_W) in yellow; (v) tibia length (Ti_L), and tibia width (Ti_W), length of compound eye (E_L), width of compound eye (E_W), and total surface of compound eye (E_S) in green; (vi) diameter of facet (Facet), and total numbers of ommatidia (Om) in maroon; and (vii) diameter of median ocellus (MOc) in light blue. PC-QTLs of the eye parameters and body size are all coloured black: for eye size (E_PCA_1 and E_PCA_2) and for body size (S_PCA1, S_PCA_4 and S_PCA_5). Linkage group number are shown on top of the groups, and map distance (cM) is shown on the left margin of the figure. The genetic map originated from Stoll et al. 2011. The significant markers within suggestive and significant QTL regions are shown with correspondence Kruskal-Wallis significance level (* = 0.10; ** = 0.05; *** = 0.01; **** = 0.005; ***** = 0.001; ****** = 0.0005; and ******* = 0.0001).

