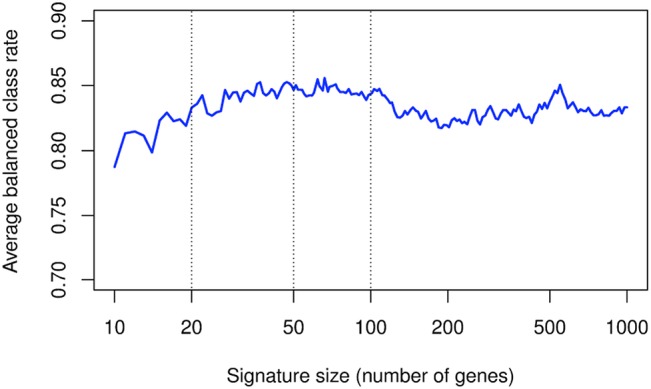
Fig 1. Balanced classification rate (BCR) of a nearest neighbor classifier as a function of the signature size (number of genes) used for prediction.

Lists of genes of progressively decreasing sizes were determined based on high-density transcriptomic data, and used in order to predict diagnosis in 25 patients with RA, SLE, OA, SA and MIC. BCR is plotted in function of the signature size. Lists of genes containing between 20 and 100 probe sets provide performances that range between 83% and 85%.
