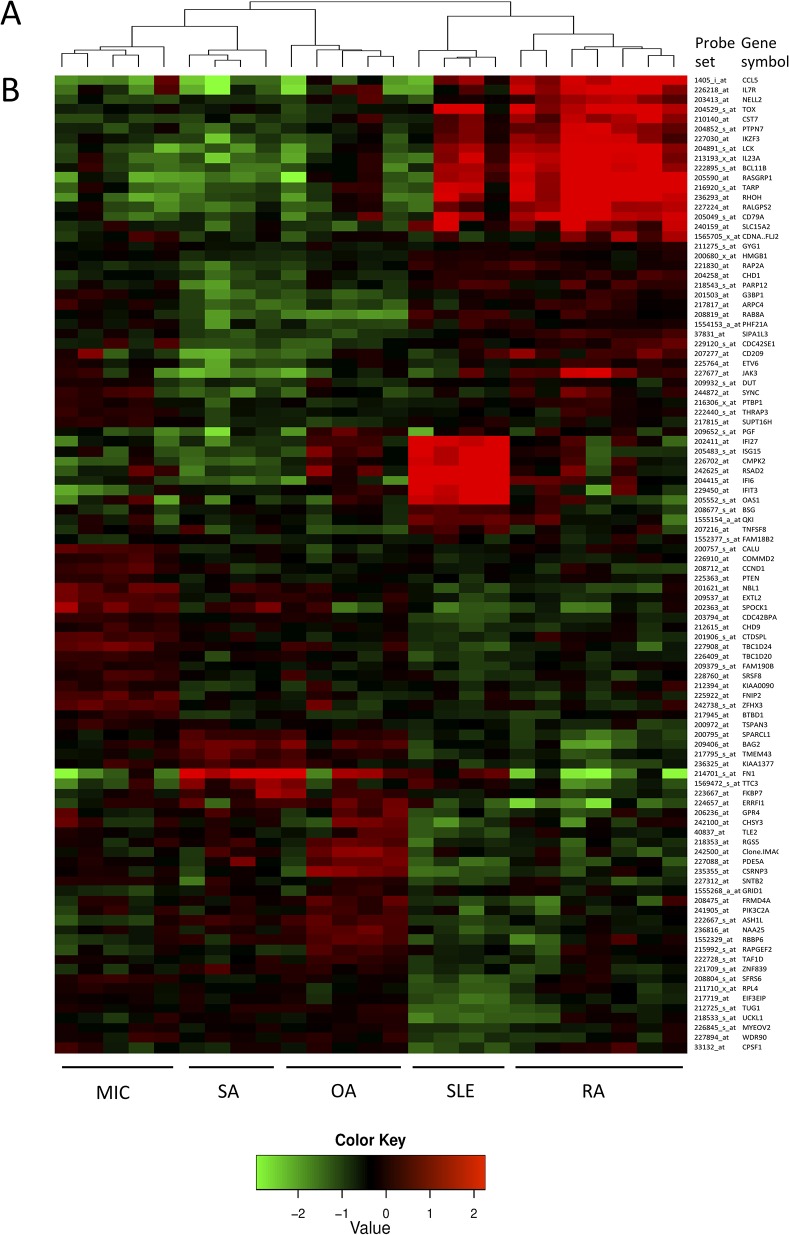
Fig 2. High-density gene expression data used for the design of the low-density platform.
Analyses performed on high density transcriptomic data resulted in the selection of 100 probe sets differentiating patients with RA, SLE, OA, MIC and SA. The probes and gene symbols are also listed in S3 Table. (A) Hierarchical clustering algorithms using the high density gene expression values of these genes (and based on the Pearson correlation distance) distribute the samples into “inflammatory” (RA and SLE) and “high extra-cellular matrix turn-over” (OA, SA and MIC) clusters. They also identify diagnostic subdivisions. (B) The high density gene expression values of these 100 genes are displayed according to the clinical diagnosis of the samples.

