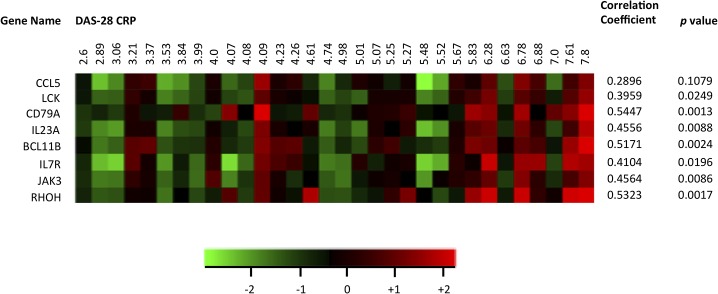
Fig 3. Effect of disease activity on gene expression in RA samples.

Mean centered log2-transformed expression levels of selected T cell activation-associated transcripts were extracted from HGU133 Plus2.0 GeneChip array data sets of 32 patients with RA. DAS28-CRP scores were retrieved from the medical files of the patients, and the samples are sorted by ascending DAS28-CRP. Correlation coefficients (Pearson r) between gene expression and DAS28-CRP are displayed for each transcript.
