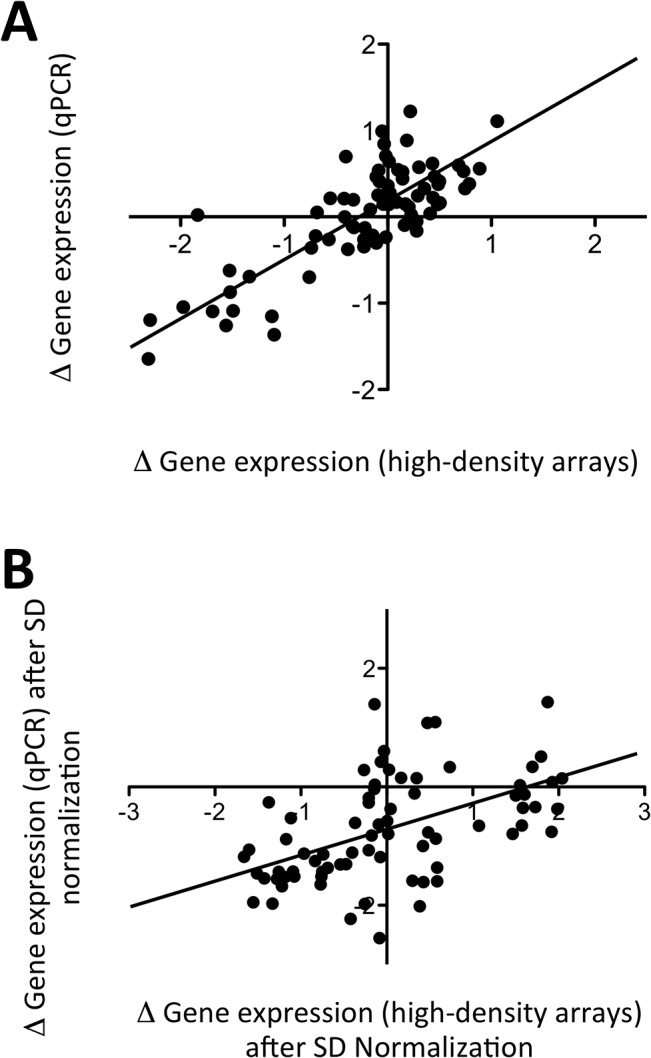
Fig 6. Comparison of gene expression differences between samples from patients with OA, RA and SA, using high-density arrays versus qPCR.

Independent sets of samples were hybridized on high-density (HGU133 Plus 2.0 GeneChip) and analyzed by qPCR (Taqman low density array). (A) Differences in mean (log2-transformed) gene expression values between OA and (RA+SA) samples are displayed for the samples analyzed using high-density arrays (x axis) versus qPCR (y axis). (B) The same data from OA and (RA+SA) samples are displayed after normalization of each mean (log2-transformed) gene expression value by its standard deviation.
