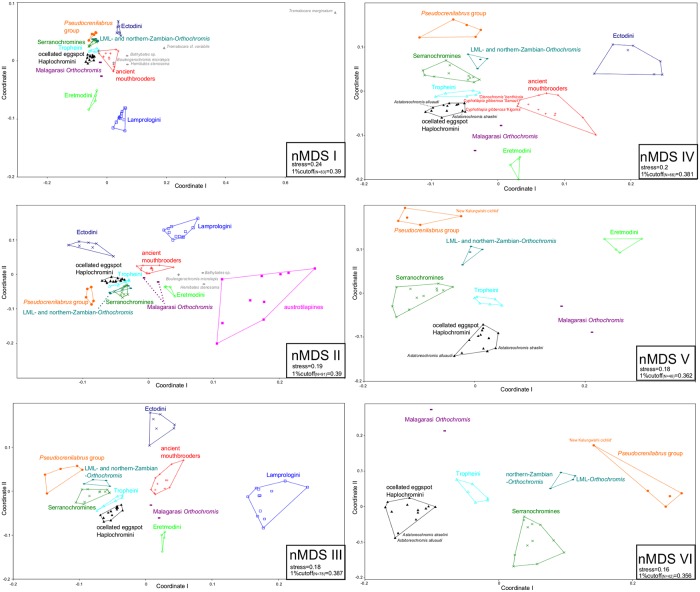
Fig 7. Stepwise reduced nMDS plots.
To infer phylogenetic relationships in an altered variance space, major sistergroups of ingroup taxa according to the consensus NJ topology were stepwise eliminated. NMDS plots are based on Jaccard´s distances [62] of nc (AFLP) data. Kruskall’s stress values as well as the corresponding 1% cutoff values [74] are given for each projection.

