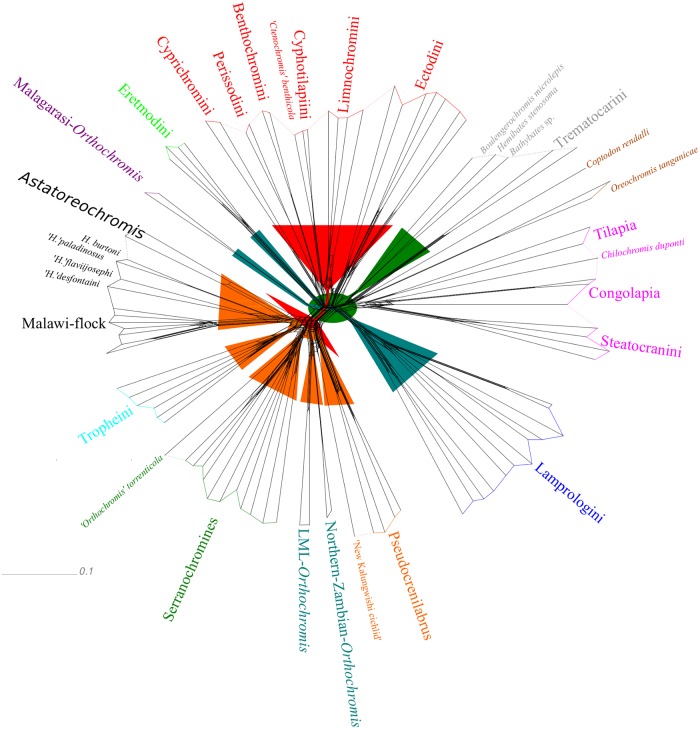
Fig 8. NeighborNet projection based on AFLP data and major effects of HET.
The NeighborNet network topology is based on Jaccard’s distances [62]. Specimens of distinct lineages are grouped and informal groups used in this work are depicted in different colours. Funnels highlight conflicting signal corresponding to the four major effects detected with HET and inference of cyto-nuclear discordances and are coloured according to Fig 3 and Fig 6.

