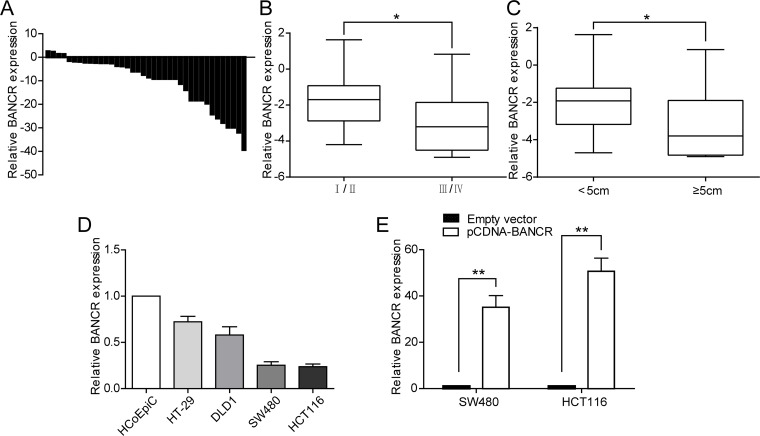
Fig 1. Relative expression of BANCR in colorectal cancer tissues and colorectal cancer cell lines.
(A) Relative expression of BANCR in colorectal cancer tissues (n = 38) compared with corresponding non-tumor tissues (n = 38). BANCR expression was examined by qPCR and normalized to GAPDH expression. Results were presented as the fold-change in tumor tissues relative to normal tissues. (B and C) Data are presented as relative expression level in tumor tissues. BANCR expression was significantly lower in patients with a higher pathological stage and larger tumor size (shown as ΔCT). (D) BANCR expression levels of colorectal cancer cell lines (HT-29, DLD1, SW480, and HCT116) compared with the human colonic epithelial cells (HCoEpiC). (E) qPCR analysis of BANCR expression levels following the treatment of SW480 and HCT116 cells with pCDNA-BANCR and empty vector.*, P < 0.05 and **, P < 0.01.

