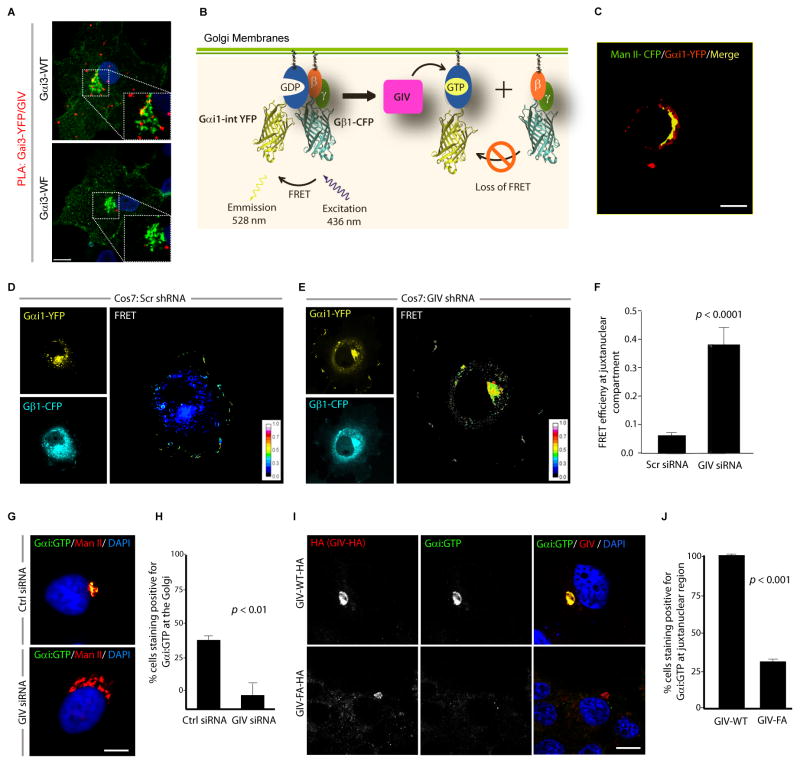
Figure 1. GIV activates Gαi at the Golgi via its GEF motif.
(A) COS7 cells transfected with YFP tagged Gαi3-WT or the Gαi3-WF mutant were analyzed for interaction between endogenous GIV and Gαi3-YFP by in situ PLA using mouse anti-GFP and rabbit anti-GIV antibodies. Red spots indicate the presence of interaction. Insets show the Golgi region at higher magnification (white dashed box). Bar = 10 μm. (B) Schematic for the Gαi1-YFP and Gβ1-CFP constructs used as paired FRET probes in D, E. FRET indicates the presence of inactive trimer, whereas activation of Gi is associated with loss of FRET. (C) COS7 cells expressing Gαi1-YFP (pseudo-colored green) and Man II-CFP (pseudo-colored red) were fixed and analyzed by confocal microscopy. A high degree of colocalization (yellow pixels) indicates that the Gαi1-YFP predominantly localizes on the Golgi. (D, E) Control (Scr shRNA) and GIV-depleted (GIV shRNA) COS7 cells (See also Fig. S1C) were cotransfected with Gαi1-YFP, Gβ1-CFP and Gγ2 (untagged) and live cells were analyzed by FRET imaging at steady-state, in the presence of 10% serum. Representative freeze-frame YFP, CFP and FRET images are shown. FRET image panels display intensities of acceptor emission due to efficient energy transfer in each pixel. (F) Bar graphs display FRET efficiency (Y axis). FRET at the Golgi is strong in GIV-depleted cells (E; FRET efficiency = 0.37 ± 0.06), but minimal in controls (D; FRET efficiency = 0.061 ± 0.01). Results are expressed as mean ± S.D. Data represent 5 regions of interest (ROIs) analyzed over the pixels corresponding to the Golgi of 3–5 cells from 5 independent experiments. (G) Control (Scr siRNA) and GIV-depleted (GIV siRNA) COS7 cells (see also Fig. S1D) maintained in 10% serum were fixed and stained for active Gαi (green; anti-Gαi:GTP mAb) and Man II (red) and analyzed by confocal microscopy. Activation of Gαi was detected frequently in control but not in GIV-depleted cells. When detected, active Gαi colocalizes with Man II (yellow pixels in upper panel). (H) Bar graph displays % cells that stain positive for active Gαi (Y axis) in control and GIV-depleted cells analyzed in G. (I) Active Gαi is detected frequently in cells expressing GIV-WT (upper) but not in those expressing GIV-FA (lower). When detected, active Gαi colocalizes with GIV-HA (yellow pixels in merged panel). COS7 cells expressing HA tagged GIV-WT or GIV-FA were fixed and stained for GIV (red; anti-HA mAb) and active Gαi (green; anti-Gαi:GTP mAb) and analyzed by confocal microscopy. (J) Bar graph displays % cells expressing GIV-HA (WT or FA) that stain positive for active Gαi (Y axis) in I.

