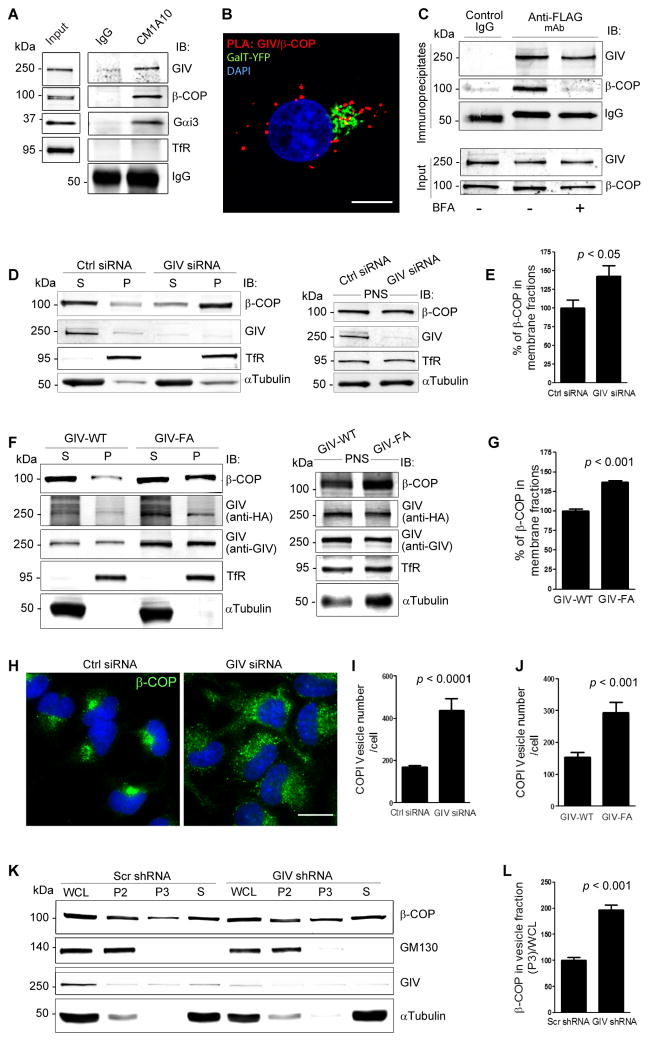
Figure 2. GIV associates with COPI vesicles and is required for uncoating of COPI vesicles.
(A) COPI membranes were immunoisolated from a crude membrane (100,000 g pellet; see Fig. S2A) fraction prepared from COS7 cells using mAb CM1A10 (which recognizes coatomer), and bound immune complexes were analyzed for GIV, β-COP, Gαi3, and transferrin recepter (TfR, a negative control) by immunoblotting (IB). (B) HeLa cells expressing GalT-YFP (Golgi marker, pseudocolored green) were fixed and analyzed for interactions between GIV and β-COP by in situ PLA (red). Nuclei = DAPI (blue). Bar = 10 μm. Negative control (S2B) showed no signal. (C) HeLa cells expressing GIV-FLAG were treated or not with 5 μg/mL BFA for 30 min prior to lysis. Equal aliquots of lysates were immunoprecipitated with anti-FLAG mAb and immune complexes were analyzed for β-COP by immunoblotting. (D) Membrane (P, 100,000 g pellet) and cytosolic (S, 100,000 g supernatant) fractions (left panel) were prepared from post-nuclear supernatants (PNS, right panel) of control (Ctrl siRNA) or GIV-depleted (GIV siRNA) COS7 cells and analyzed for the indicated proteins by immunoblotting. (E) Bar graphs display the relative abundance of β-COP in membrane fractions in D, derived from the equation [(P)/(S + P)] × 100. Data was normalized to control and expressed as % changes. Results are expressed as mean ± S.E.M. (F) GIV-depleted cells were treated with adenovirus containing RNAi-resistant GIV-WT or GIV-FA. Homogenates of these cells were used to prepare membrane and cytosolic fractions as in D and analyzed by immunoblotting. (G) Bar graphs display the relative abundance of β-COP in membrane fractions in F. (H) Control (Ctrl siRNA) or GIV-depleted (GIV siRNA) HeLa cells were prepermeabilized with 0.1% Saponin (to release cytosolic β-COP), stained for β-COP (green) and the nucleus (DAPI, blue), and analyzed by confocal microscopy. Bar = 10 μm. (I) Bar graphs display the number of COPI vesicles per cell in H, as determined by 3D-reconstruction using Imaris software (n=3; mean ± SEM; >20 cells/experiment). (J) Bar graphs display the number of COPI vesicles in adeno-GIV-WT-HA or -GIV-FA-HA infected cells (see Fig. S2F) that were analyzed exactly as in H, I (n=3; mean ± SEM; >10 cells/experiment/condition). (K) Whole cell lysates (WCL) of control (Scr shRNA) or GIV-depleted (GIV shRNA) cells were subjected to differential centrifugation to obtain a 15,000 g (P2) fraction enriched in Golgi membranes and a 100,000 g (P3) fraction containing COPI vesicles, and a cytosolic fraction (S, 100,000 g supernatant). Fractions were analyzed for GIV, β-COP and GM130 (Golgi marker) by immunoblotting. (L) Bar graphs display the quantification of β-COP in P3 fractions normalized to WCL. Increased membrane-association of β-COP as determined by membrane-cytosol fractionation or increased peripheral vesicular staining of β-COP we observe in GIV-depleted cells (2D, E, H, I) or in cells expressing GIV-FA (2F, G, J) is not due to changes in absolute cellular levels of β-COP (see S2G, H).

