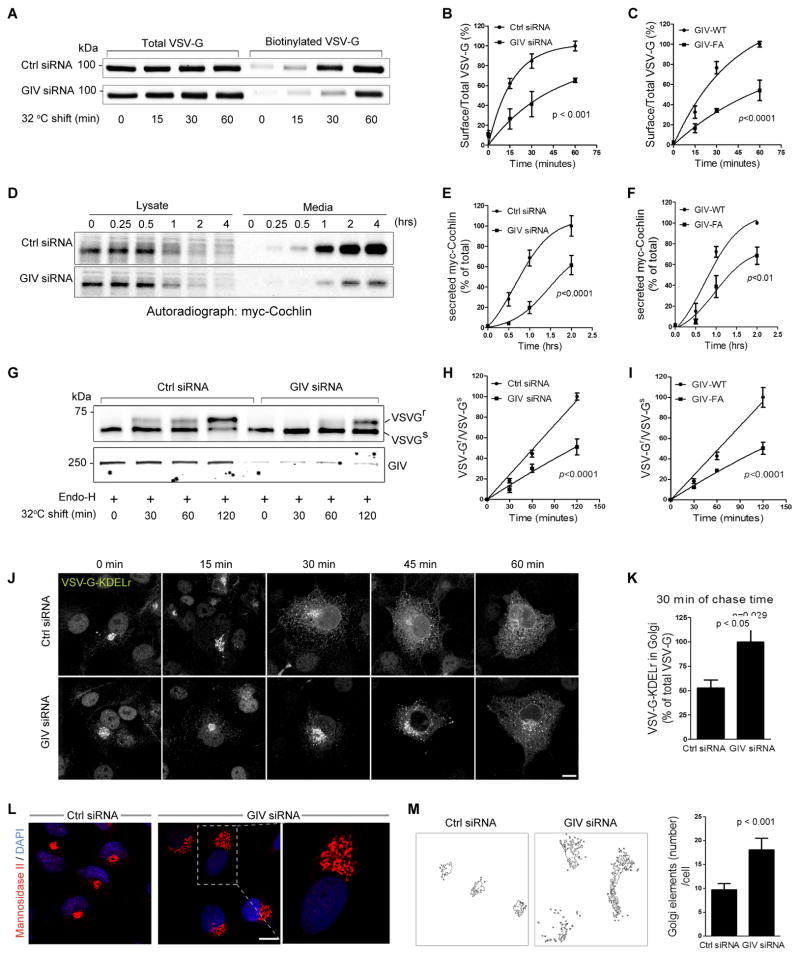
Figure 4. GIV and its GEF function are required for ER-Golgi vesicle transport and integrity of the Golgi structure.
(A) Control (Ctrl siRNA) or GIV-depleted (GIV siRNA) COS7 cells were transfected with VSVG-tsO45-GFP and incubated at 40°C overnight before shifting to 32°C for the indicated times. Cell surface proteins were labeled with membrane-impermeable Sulfo-NHS-SS-Biotin as described in Methods. Surface biotinylated and total VSVG-GFP were analyzed by immunoblotting with anti-GFP. (B) Graphs display the quantification of VSVG trafficking in control or GIV-depleted cells expressed as surface biotinylated to total VSVG-GFP, as determined by band densitometry. Data was normalized to control and expressed as % changes. (n=3; error bars = S.E.M). (C) Graphs display the quantification of VSVG trafficking (see Figure S4A) in cells expressing GIV-WT or GIV-FA calculated as in B (n=4; error bars = S.E.M). (D) Control (Ctrl siRNA) and GIV-depleted (GIV siRNA) HeLa cells transfected with myc-cochlin were pulsed with [35S]Met-Cys (100 mCi/mL) for 30 min, washed, and chased for the indicated times prior to lysis. Equal aliquots of media and cell lysates were immunoprecipitated with anti-myc mAb and analyzed for [35S]-labeled-cochlin by autoradiography. (E) Graphs display the quantification of results in D, as determined by band densitometry and expressed as % myc-cochlin secreted in media/total myc-cochlin in lysates (n=5). (F) Graphs display the quantification of myc-cochlin secretion from HeLa cells stably expressing GIV-WT or GIV-FA (see Figure S4B) expressed as % myc-cochlin secreted in media/total myc-cochlin in lysates (n=5). (G) Control (Ctrl siRNA) or GIV-depleted (GIV siRNA) COS7 cells were infected with VSVG-tsO45 retrovirus for 1 h at 32°C and shifted to 40°C for the next 16 h. Cells were then shifted to 32°C for the indicated period of time prior to lysis. Equal aliquots of lysates were incubated with Endo-H (+) and subsequently analyzed for Endo-H-resistance (upward shift, upper panel) and GIV depletion (lower panel) by immunoblotting using anti-VSV and anti-GIV, respectively. (H) Graphs display the quantification of the data presented in G, expressed as the ratio between Endo-H-resistant (VSVGr; upper band) vs Endo-H-sensitive VGV-G (VSVGs; lower band) at various time points (n=4). (I) Graphs display the ratio between Endo-H-resistant vs sensitive VGV-G in cells expressing GIV-WT or GIV-FA (n=3) (see Figure S4E). (J) Control (Ctrl siRNA) or GIV-depleted (GIV siRNA) COS7 cells transfected with chimeric tsO45-VSVG-KDELr-Myc were first incubated at 32°C and then shifted to 40°C (to allow transport of the chimeric receptor to the ER) for the indicated times, fixed and stained for myc (white pixels). Bar = 10 μm. (K) Bar graphs display the % of the total tsO45-VSVG-KDELr-Myc within the Golgi region, quantified from confocal images of cells at 30 min (see Methods for details) (n=3; 5 cells/experiment). (L) Control (Ctrl siRNA) or GIV-depleted (GIV siRNA) COS7 cells were fixed and stained for Man II (red) and nuclei (DAPI; blue), and analyzed by confocal microscopy. Representative images of control or GIV-depleted cells are shown with a magnified view of the boxed area enlarged to the right. Bar = 10 μm. (M) Quantitative analysis of the Golgi phenotype in control and GIV-depleted cells by Image J (NIH) is shown (left panels). A fixed threshold was applied to all images, and objects were measured using the Analyze Particles function. Bar graphs (right) display the average number of Golgi elements per cell (n=3; >14 cells/experiment).

