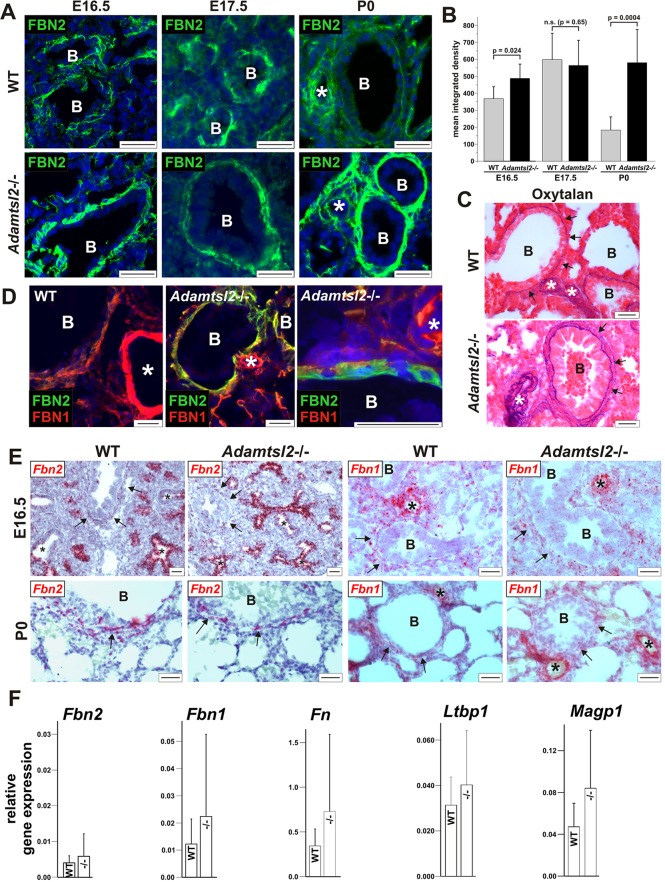
Fig. 5.
Peribronchial microfibril dysregulation in Adamtsl2−/− lungs. (A) Immunolocalization of FBN2 (green) in frozen (E16.5) (from n=3 per genotype) or paraffin-embedded (E17.5, P0) (from n>6 per genotype) lung sections. Note the stronger FBN2 staining in Adamtsl2−/− bronchi compared to the WT. The genotype of the E16.5 controls is Adamtsl2+/−. (B) Quantification of mean±s.d. integrated density of the fluorescence signal for FBN2 at E16.5 (n=3 per genotype), E17.5 (n=3 per genotype) and P0 (n>6 per genotype). A small, but statistically significant difference between the WT and Adamtsl2−/− lungs was observed at E16.5. A strong increase in the mean integrated density was observed in the Adamtsl2−/− lungs at P0. (C) The total amount of microfibrils is greater in the bronchial wall of newborn Adamtsl2−/− lungs as assessed by histochemical staining for oxytalan fibers (arrows) (from n=4 per genotype). (D) Co-immunostaining of FBN2 (green) and FBN1 (red) in frozen sections from lung tissue at birth using antibodies covalently labeled with the respective fluorophores. Nuclei are counterstained with DAPI (blue). In the Adamtsl2−/− bronchi, FBN2 staining predominates peri-bronchially, but is absent in blood vessels. In WT and mutant mice, FBN1 staining is present primarily in blood vessels (white asterisk), with weaker staining of the bronchial wall. The lower panel shows a magnified view of sub-epithelial FBN2 accumulation (green) in an Adamtsl2−/− bronchus (from n=2 per genotype). (E) In-situ hybridization for Fbn2 and Fbn1 mRNA (red) shows that there is strong Fbn2 expression in bronchial epithelium at E16.5 in WT and Adamtsl2−/− mice (asterisks) (from n>4 per genotype). Note the absence of Fbn2 expression in more developed bronchi (upper left panel) and weak Fbn2 expression in the bronchial smooth muscle cell layer (arrows). Fbn1 is predominantly expressed in the pulmonary blood vessels. (F) qRT-PCR analysis of expression of microfibril associated genes in lung at P0 normalized to expression of Gapdh (mean±s.d., n=3 per genotype). No significant changes were detected between Adamtsl2−/− (−/−) and WT lungs. Scale bars: 25 µm. B, bronchi; asterisk, blood vessel.

