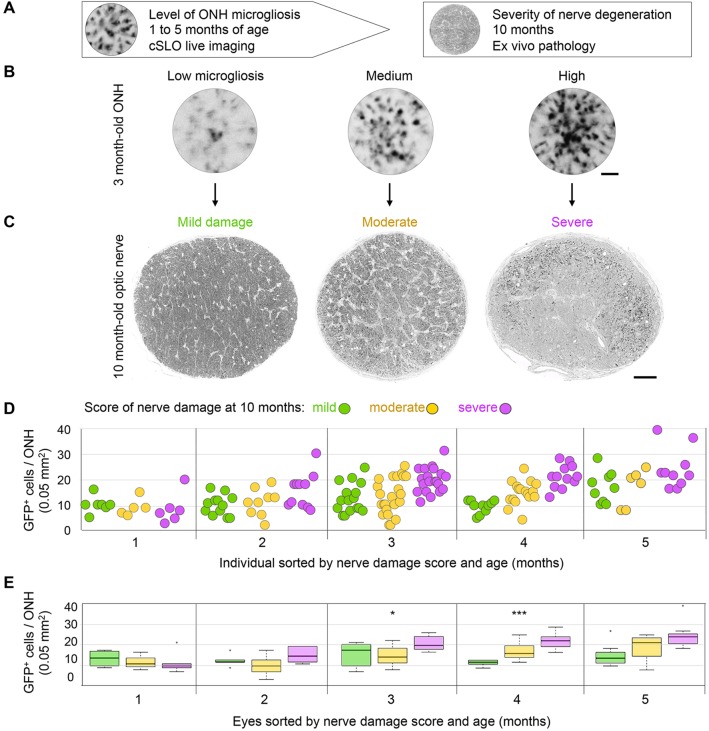
Fig. 4.
Late nerve damage is preceded by early microgliosis at the ONH. (A) Experimental design. (B) Live cSLO images of GFP+ cells localized to the ONH at 3 months of age in Cx3cr1+/GFP DBA/2J mice showing examples of low, medium and high levels of microgliosis. (C) Light-microscopy images of optic nerve cross-sections at 10 months of age for these same eyes, representative of mild, moderate and severe damage, as assessed by visual scoring. (D) Microgliosis level, quantified as total number of GFP+ cells per ONH at 1 to 5 months of age (n=19, 31, 60, 36 and 25 eyes per respective age group), plotted for individual eyes and categorized by their corresponding optic nerve damage score at 10 months of age (color-coded as indicated). (E) Box plots of the same dataset illustrate significant changes at 3 and 4 months of age (*P<0.05 and ***P<0.001, respectively; Kruskal–Wallis rank ordered test), most notably in the severe nerves at both ages, and in the moderate nerves at 4 months. Plots indicate the median (thick line), interquartile range (IQR; box height), and data within 1.5 times the IQR (whiskers) or greater (outliers, circles). Scale bars: 250 µm (A) and 50 µm (C).

