
Fig. 3.
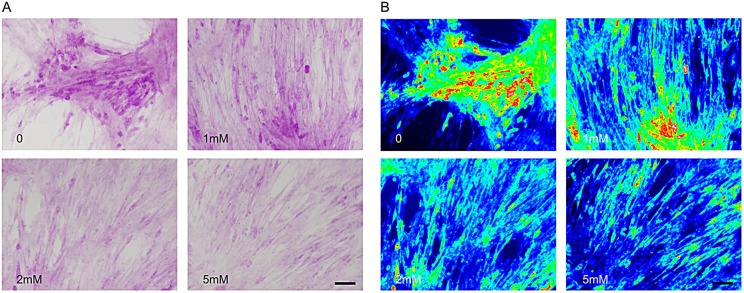
Reduced glycogen accumulation in KI myotubes after treatment with VPA. (A,B) We observed a gradual reduction in glycogen content as myotubes were treated with increasing VPA concentrations. (B) Red areas correspond to sites of major glycogen accumulation, whereas ‘cold’ colors (green, blue) represent sites of low PAS staining in myotubes. Scale bars: 50 µm.