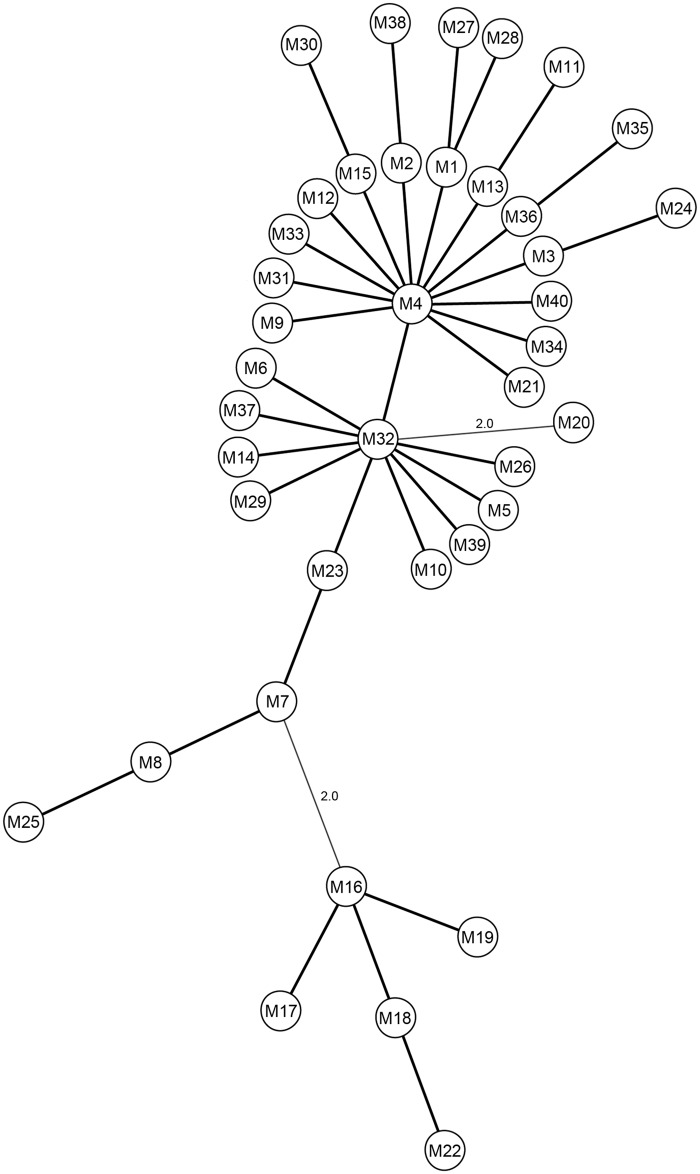
Fig 2. Minimum spanning tree (MST) based on the SSR profiles of the 4 loci for all 40 SSR-types identified in the current study.
The tree was generated using the BioNumerics 7.1 multilocus sequence typing program and the circles represent the M1-M40 SSR-types. Thick lines represent only one variation amidst the 4 loci, whereas thin lines represent 2 differences between the 4 loci, the latter of which is indicated.

