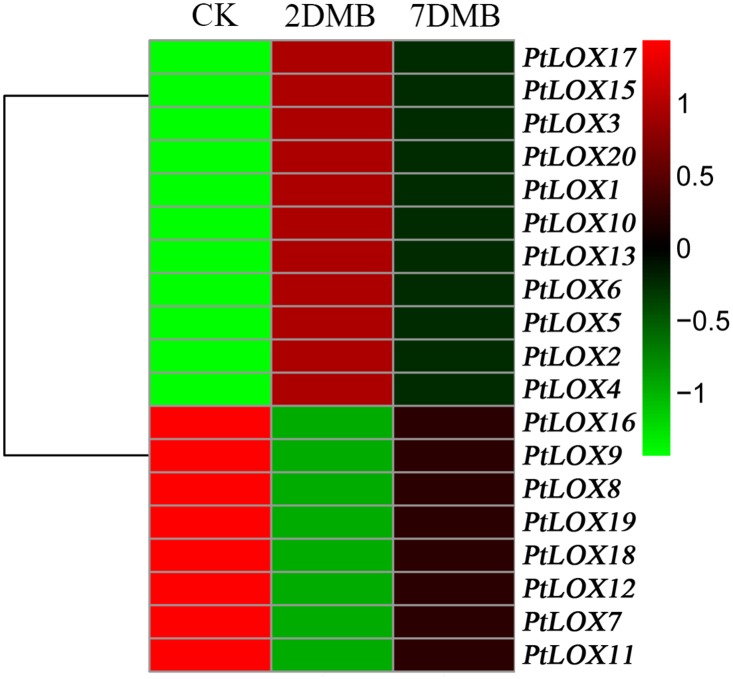
Fig 8. Differential expression of Populus LOX genes under different stress treatments.
Expression is indicated as fold-change of experimental treatments relative to control samples and visualized in heatmaps (see Materials and Methods). Green represents low levels and red indicates high levels of transcript abundance. Microarray data under the series accession number GSE23726 were obtained from the NCBI GEO database. CK: 0 days after inoculation with Marssonina brunnea; 2DMB: 2 days after inoculation with Marssonina brunnea; 7DMB: 7 days after inoculation with Marssonina brunnea.

