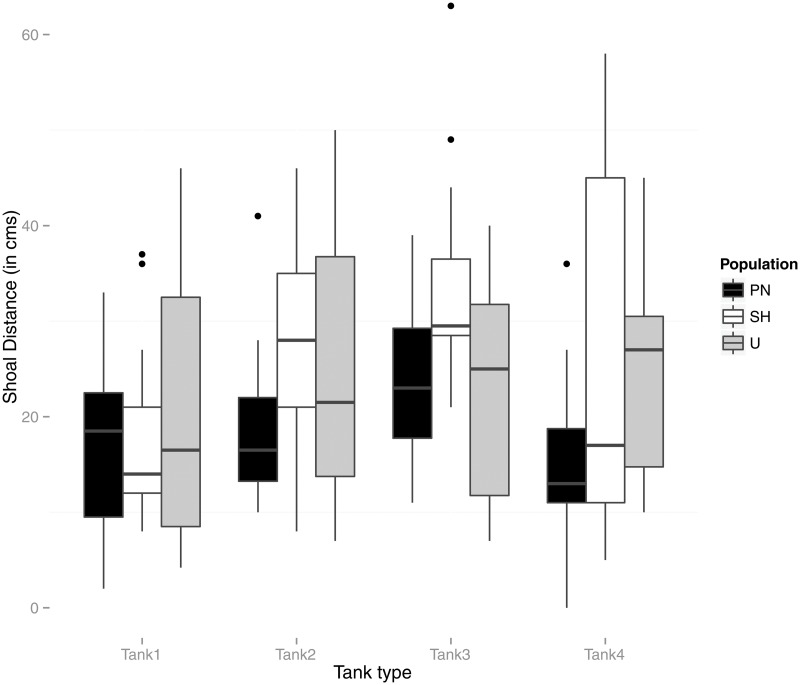
Fig 3. Box-plot representing population-wise measurements of Shoal distance (i.e. average distance of pairs of individuals in each shoal in cms.) in each tank treatment type (tank 1, tank 2, tank 3, and tank 4).
Tank 1 (Flow, no vegetation), 2 (No Flow, vegetation), 3 (No flow, no vegetation) and 4 (Flow, Vegetation). Outliers are shown as solid dots.

