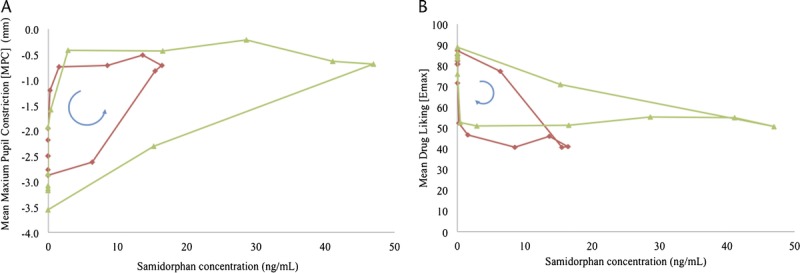
FIGURE 3.

Hysteresis plot of pupillary responses (MPC) and subjective response (Emax on drug liking VAS) to remifentanil versus plasma samidorphan concentrations following administration of 10 and 20 mg samidorphan. The direction of time is presented by the arrow, beginning at a plasma samidorphan concentration of 0. All post–samidorphan remifentanil challenge timepoints on days 2 through 9 (168 hours postdose) are represented. The red line represents samidorphan 10 mg, and the green line represents samidorphan 20 mg.
