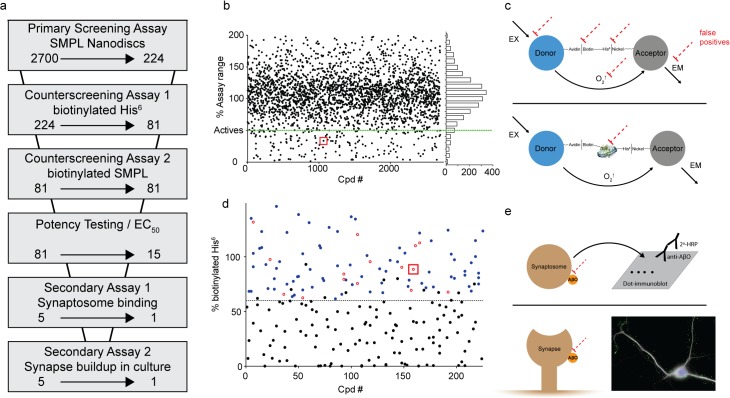
Fig 6. Screening strategy effectively eliminates false positives.
(a) Screening assays used to evaluate the effect of Spectrum Collection molecules on AβO binding. The arrows indicate the reduction in compounds resulting at each step. (b) Compiled data from the primary AlphaScreen assay are shown in a single graph normalized to POPC and SMPL in-plate controls. (c) Schematics of counterscreening assays designed to identify false positive compounds acting on off-target elements of the primary screening assay (dashed red lines). Assays use AlphaScreen donor and acceptor beads linked together by either biotinylated hexahistidine (top) or Nanodiscs containing biotinylated synaptic proteins (bottom). (d) Data from the biotinylated hexahistidine counterscreen. Black symbols denote compounds classified as likely false positives. Blue symbols denote compounds that were retested in dose-response format (Examples shown in Fig 7), and the compounds showing significant signal reduction at 1 μM are shown as open red circles. (e) Secondary, orthogonal assays to verify compound efficacy in preventing AβO binding include a dot immunoblot test for AβO binding to rat cortical synaptosomes (Top; shown in Fig 8) and an immunocytochemical analysis of AβO binding to cultures of rat hippocampal neurons (Bottom; shown in Fig 9 for ATA). Red squares in panels b and d identify the data points associated with ATA.

