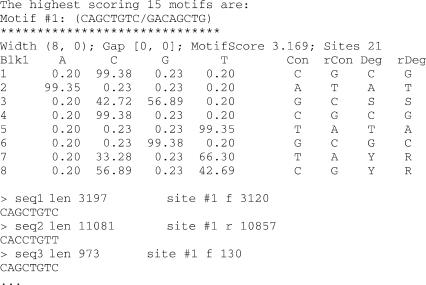
Figure 1.
Typical output for BioProspector, CompareProspector and MDscan. Highest scoring motifs are listed. The first line for each motif lists motif width (blk 1, blk 2), gap length (min gap, max gap), motif raw score and the number of aligned sites. The motifs are shown as position-specific probability matrices. Represented as IUPAC symbols are consensus (Con)—the most abundant base, reverse complement consensus (rCon), degenerate consensus (Deg)-where all bases with >25% abundance are considered, and reverse degenerate consensus (rDeg). Also listed are sequences that have the motif, with sequence name, length of the sequence, site number, orientation and location of the site (‘f’ means the site is on the forward strand, whereas ‘r’ means the site is on the reverse strand), and the actual sequence of the site.

