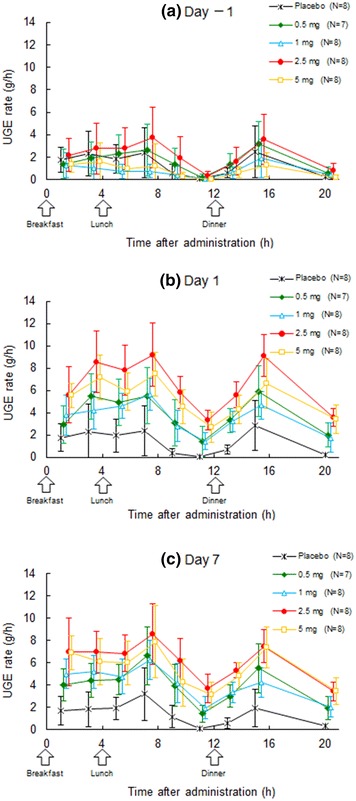
Fig. 3.

Urinary glucose excretion rate–time profiles on Day −1 (a), Day 1 (b), and Day 7 (c). The UGE rate was significantly greater in all four luseogliflozin groups than in the placebo group at all times on Days 1 and 7, reaching a peak at 2–4 h after each meal. Values are presented as the mean ± standard deviation. UGE urinary glucose excretion
