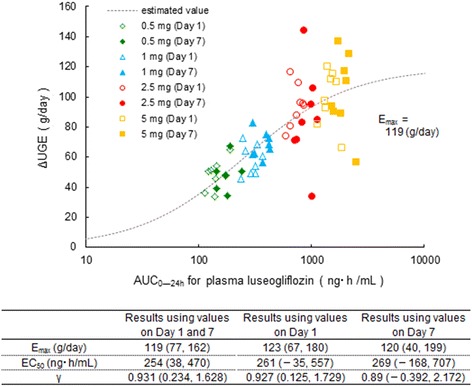
Fig. 6.

Regression analysis with the E max model was used to examine the relationship between the plasma luseogliflozin concentration and the change in UGE in each subject. The values are presented as the estimates (95% confidence interval). E max maximum change in urinary glucose excretion, EC 50 area under the concentration–time curve at 50% of the urinary glucose excretion, γ Hill coefficient, UGE urinary glucose excretion
